Download
1 / 18
180 likes | 299 Vues
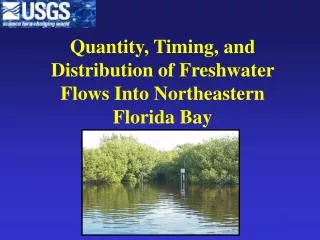
Ecological Effects of Potential Minimum Flows and Levels for Florida Bay David Rudnick 1 , Melody Hunt 1 , Christopher Madden 1 , Robin Bennett 1 , Amanda McDonald 1 , and Joel VanArman 2 1 Coastal Ecosystems Division and 2 Planning and Resource Evaluation Division

E N D
Ecological Effects of • Potential Minimum Flows and Levels • for Florida Bay • David Rudnick1, Melody Hunt1, Christopher Madden1, Robin Bennett1, • Amanda McDonald1, and Joel VanArman2 • 1Coastal Ecosystems Division and • 2Planning and Resource Evaluation Division • South Florida Water Management District
Fresh water flow: • Limited management control (Tamiami Trail, L31, C111) • FL Bay inflow diffuse (mostly via creeks into northeast bay)
MFL Analysis Approach • Resource - based using SAV in Transition Zone ponds. • Identify salinity threshold for significant harm to SAV indicator species • Determine concurrent salinity impacts along gradient from Transition Zone into NE Florida Bay
Evaluation Components • Hydrologic Analyses: • Relationships among levels, flows, and salinity • Literature Review: • Salinity effects on SAV species, major fish and invertebrate species • SAV Analyses: • Statistical analysis of transition zone and FL Bay SAV and salinity • Experiments on major SAV species (salinity tolerance and physiological response) • Dynamic modeling of SAV (Halodule and Thalassia) • Fish and Invertebrate Analyses: • Statistical modeling of higher trophic level species and forage fish assemblage
Hydrologic Analyses • Hydrologic Models: • Regression models • Mass balance models • Products: • Water Budgets • Sensitivity to managed flow • Analysis of alternatives
Correlation of Annual Maximum Salinity with Annual Rainfall and Flow
Fresh Water Flow (1970 - 2000) Flow (thousands acre-feet) Fresh water flow to NE Florida Bay
Estimated salinity in Upper Taylor River Pond Jan Dec 2002 1970 > 50 ppt 40 – 50 ppt 30 – 40 ppt 20 – 30 ppt 10 – 20 ppt 0 – 10 ppt Black boxes: at least two consecutive years > 30 ppt
Estimated salinity in Little Madeira Bay Jan Dec 2002 1970 > 50 ppt 40 – 50 ppt 30 – 40 ppt 20 – 30 ppt 10 – 20 ppt 0 – 10 ppt Black boxes: when Transition Zone with at least two consecutive years > 30 ppt
Ecological Analyses • Transition zone SAV: salinity response • Florida Bay SAV: salinity response • Florida Bay higher trophic level: salinity • and habitat response
SAV as an Ecological Indicator • Ecological Value • Habitat • Sediment Stability • Water Quality Benefits • Food Source • Fresh water and brackish species sensitive to flow • History of use and acceptance Ruppia maritima (widgeon grass)
Transition Zone SAV Cover and Salinity • When salinity > 30 ppt, SAV habitat almost absent from National Audubon Soc (Frezza and Lorenz)
Salinity effects on Ruppia reproductive success • Literature indicates failure at > 30 ppt (Kantrud 1991) • Koch & Dawes experiment: no seed germination at 30 ppt, slow at 15 ppt • Durako & Koch experiment on FL Bay seeds (below): no germination > 30 ppt Salinity (ppt) from Durako and Koch 2005
Little Madeira Bay Eagle Key Basin Everglades-Florida Bay Gradient: Modeled SAV Response Dual species model results indicate decreasing Halodule at > 30 ppt
Higher Trophic Level Evaluation • Statistical model developed from comprehensive Florida Bay database (20 species, 25 years) • Results show high salinity (>40 ppt) results in decreased fish and invertebrates because of salinity stress and Halodule loss.
Conclusions: • Ruppia proposed as an indicator • When salinity > 30 ppt, Ruppia typically absent and reproductive failure likely • When Ruppia absent, SAV habitat lost • When salinity 30 ppt in transition zone, salinity is near 40 ppt in northeastern FL Bay • SAV model results indicate Halodule loss in northeast Bay near 40 ppt • Higher trophic level statistical models indicate hypersalinity and habitat quality effects • Protection of Ruppia also protects transition zone and northeastern Florida Bay resources (SAV habitat and fauna)