Download
1 / 32
320 likes | 442 Vues
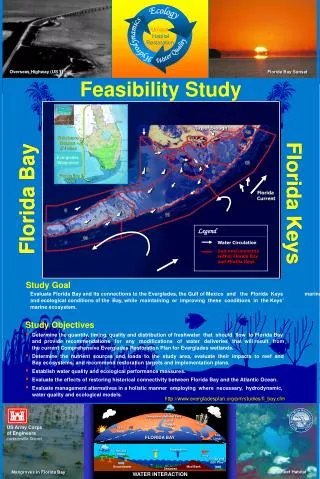
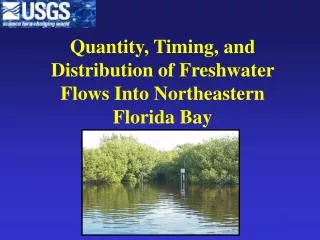
Quantity, Timing, and Distribution of Freshwater Flows Into Northeastern Florida Bay. Objectives. Collect continuous stage, velocity and salinity data at major creeks flowing into northeastern Florida Bay Compute discharge at creeks and study the quantity, timing and distribution of that flow.

E N D
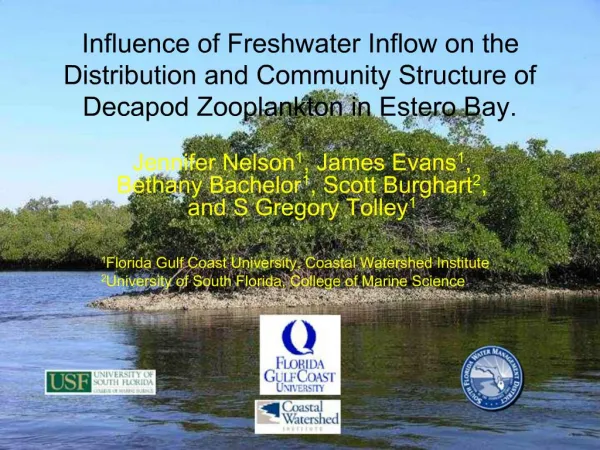
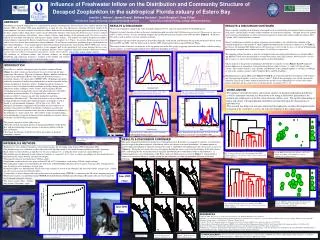
Quantity, Timing, and Distribution of Freshwater Flows Into Northeastern Florida Bay
Objectives • Collect continuous stage, velocity and salinity data at major creeks flowing into northeastern Florida Bay • Compute discharge at creeks and study the quantity, timing and distribution of that flow
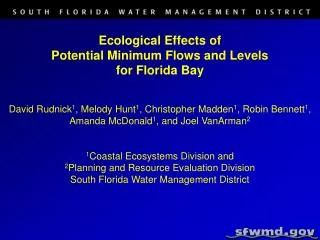
Why is Flow Information Needed? Accurate flow information is needed to help understand the circulation, mixing, and salinity dynamics of Florida Bay and the Everglades Flow data helps quantify nutrient and sediment flux Flow, stage, and salinity data help verify inland simulations of marsh-flow dynamics Performance of management practices
Overview • Study area • Monitoring sites and feature descriptions • Buttonwood embankment • Quantity and Distribution • Methods of acoustic flow measurements • Data from creek monitoring sites • Flow characteristics • Timing • Seasonal • Storm events • Management • Summary and data availability
Monitoring Sites and Structures ~ 5 miles S332 TSB S175 S18C S197
Western Extent of Study Area Upstream Taylor East Creek Taylor River McCormickCreek ~ 1.5 miles
Taylor River Study Area Upstream Taylor ~ 0.5 miles Buttonwood embankment Little Madeira Bay Taylor River
~0.5 miles Central Extent of Study Area JB5C Stillwater Creek JB2E Joe Bay JB1E JB8W Trout Creek Mud Creek
Eastern Extent of Study Area East Highway Creek Oregon Creek West Highway Creek Stillwater Creek ~ 1.5 miles
Quantity of Flow is Measured Using Acoustic Techniques Side Looking Doppler Acoustic Doppler Current Profiler (ADCP) Acoustic Velocity Meter (AVM)
~ 5 miles S332 TSB S175 S18C S197
Percent of Total Measured Discharge at Creeks from 1996 to 1999
~0.5 miles Flow Exchange Between Joe Bay and Long Sound Joe Bay Snag Bay Long Sound Florida Bay
~0.5 miles 53 49 60 104 74 569 111 7-1-99 Discharge (cfs)
~0.5 miles 50 21 49 131 324 1090 127 9-24-99 TS Harvey Discharge (cfs)
~0.5 miles 68 13 92 170 479 1880 261 10-19-99 H Irene Discharge (cfs)
Timing of Flow • Seasonal trends • Storm events • Managed flow
Seasonal Timing of Flow Showing Brackish to Fresh Transition at Taylor River
~ 5 miles S332 TSB S175 S18C S197
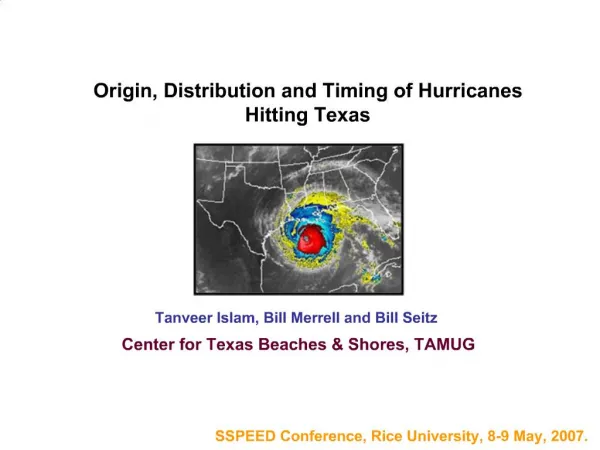
H. Irene TS. Josephine H. Mitch ~ El Nino
Summary • Collect continuous stage, velocity and salinity data at major creeks flowing into northeastern Florida Bay and compute creek discharge • Accurate information on the quantity, timing, and distribution of flow is needed to help understand the circulation, mixing, and salinity dynamics of Florida Bay and the Everglades; • Trout Creek is the major contributor of freshwater flow to northeastern Florida Bay
Summary continued • Seasonality and storm events drive the timing of flow at the creeks and structures • McCormick Creek in the western extent of the study area, shows less connection to inflow from structures and increased salinity during dry periods • Flow exchange occurs between Joe Bay and Long Sound and is controlled by water levels in the Taylor Slough and C-111 basin
Data Availability • Daily values of stage, discharge and salinity available on the SOFIA web page: • http://sophia.er.usgs.gov • 15 minute data available upon request • USGS fact sheet available on the Magnitude and Distribution of Flow into Northeastern Florida Bay