Download
1 / 22
220 likes | 346 Vues
The EPIC Calibration Meeting on March 26, 2014, focused on the analysis of the Coma cluster, a nearby cluster characterized by a uniform high-temperature distribution (7-9 keV). The meeting discussed NuSTAR calibration utilizing data from XMM-Newton. Detailed comparisons of temperature maps and broadband fits were performed, highlighting the relationship and discrepancies between NuSTAR and XMM data. The meeting concluded with future work recommendations, including additional XMM observations and fits across various energy bands for improved analysis of hot thermal plasmas.

E N D
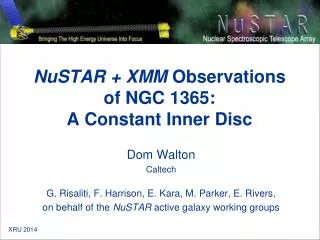
Garhing, 26 March 2014 EPIC Calibration Meeting XCAL NuSTAR-XMM WITH COMA CLUSTER FABIO GASTALDELLO INAF, IASF-Milano NuSTAR calibration & cluster WG
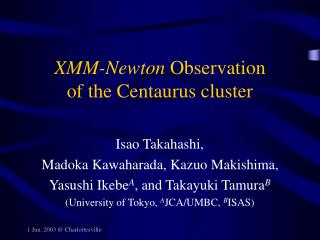
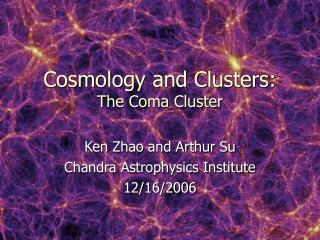
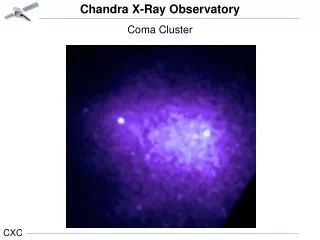
Nearby cluster with a rather uniform high temperature distribution (7-9 keV). Its center observed mainly (but not only) for calibration purposes • NuSTAR analysis with nustardas1.3.1 and CALDB 20132213 • XMM pn (doubles) analysis obsid 0153750101 December 2001 with SAS 12.0 ANALYSIS
COMA NUSTAR TEMPERATURE MAP • Boxes of 2 arcmin x 2 arcmin
COMA NUSTAR TEMPERATURE MAP WIK+14
CHECK WITH CHANDRA SANDERS+13
Mean of the ratio pn/A 0.892 with stdev 0.084 COMPARISON T A 3-20 keV-pn 0.5-10 keV
Mean of the ratio pn/B 0.893 with stdev 0.077 COMPARISON T B 3-20 keV-pn 0.5-10 keV
Mean of the ratio pn/A 1.185 with stdev 0.204 COMPARISON T A-pn 3-10 keV
Mean of the ratio pn/B 1.156 with stdev 0.189 COMPARISON T B-pn 3-10 keV
Mean of the ratio A/pn 0.986 with stdev 0.137 COMPARISON norm A 3-20 pn 0.5-10 keV
Mean of the ratio B/pn 0.967 with stdev 0.135 COMPARISON norm B 3-20 pn 0.5-10 keV
With nustardas 1.2.0 and caldb 20130509 • Mean of the ratio B/pn 1.147 with stdev 0.158 COMPARISON norm B 3-20 pn 0.5-10 keV
XMM pn BROADBAND FIT • 105/120 10.0 ± 1.1 norm 3.1± 0.1 E-03 3-10 keV
XMM pn BROADBAND FIT • 105/120 7.5 ± 0.3 norm 3.5± 0.1 E-03 0.5-10 keV
pn and its bkg nustar and its bkg COMPARISON WITH XMM pn
Nustar has the capabilities to constrain well hot thermal plasmas like the 8-9 keV emission in Coma • Comparison with XMM pn still stresses the problems with cluster broad band fitting (Nevalainen+10) • Future work: more XMM obervations, fit in varius energy band (2-7 keV), Fe line ratios SUMMARY