Brain Jogger
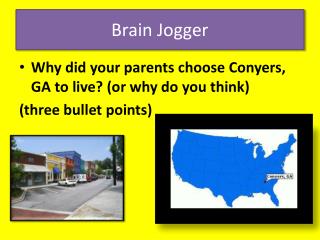
Brain Jogger. Get out your notes from yesterday. Life Expectancy, Literacy Rate, and Standard of Living. What is Life Expectancy?. The average length of a person’s life in a certain place. . Looks like a long life!!. Looks like a shorter life!!.


Brain Jogger
E N D
Presentation Transcript
Brain Jogger • Get out your notes from yesterday.
What is Life Expectancy? • The average length of a person’s life in a certain place. Looks like a long life!! Looks like a shorter life!!
Why is it important to know a country’s Life Expectancy? Countries with…
Life Expectancy Around the World • Where is the highest life expectancy? • Where is the lowest life expectancy?
What is Literacy Rate? • The percentage of people who can read and write in a certain place.
Literate- Ability to read and write • Illiterate-Inability to read and write What limitations are placed on people who cannot read or write? Shoulder Buddy
Literacy Rates Around the World • Where is the highest literacy rates? • Where is the lowest literacy rates?
Life Expectancy What do we have in common with these two graphs? Literacy Rate
9/10 Brain Jogger Complete the following sentences: • If life expectancy is low in a country, most likely the literacy rates will be __________. • If life expectancy is high in a country, then the infant mortality rate will be ________ and the standard of living will be _________. Low Low High
So what is Standard of Living? …refers to the quality and quantity of goods and services available to people, and the way these goods and services are distributed within a population. Or… With the money that you make, how well can you live?
Review This is only a majority language that is spoken. Europeans usually learn how to speak more than one language.
Assessment: • Creating a Double Bar Graph comparing 3 countries’ Life Expectancy and Literacy rate!
This is a Double Bar Graph You must have a title Must have increments You must label Must have a Key
The Rules • Create a double bar graph comparing the literacy rates and life expectancy of the Israel, Sudan, and two countries of your choice. (Use page 412-415 for your data) • You must have increments, color, title, labels, and a legend (key).
Double Bar Graph and Rules You must have a title Must have increments The Rules: • Create a double bar graph comparing the literacy rates and life expectancy of the Israel, Sudan, and two countries of your choice. (Use page 412-415 for your data) • You must have increments, color, title, labels, and a legend (key). You must label Must have a Key