DCIT
DCIT. September 25, 2012 8:30 a.m.- 3:30 p.m. “If you do what you’ve always done, you’ll get what you’ve always gotten.” -Tony Robbins. Connections. Why is it sometimes difficult to solve our own problems? http://www.youtube.com/watch?v=VrSUe_m19FY. Agenda. Anything to add?

DCIT
E N D
Presentation Transcript
DCIT September 25, 2012 8:30 a.m.- 3:30 p.m.
“If you do what you’ve always done, you’ll get what you’ve always gotten.” -Tony Robbins
Connections Why is it sometimes difficult to solve our own problems? http://www.youtube.com/watch?v=VrSUe_m19FY
Agenda Anything to add? Anything to delete?
Reviewing and Synthesizing the Ground Rules Small groups- try to come up with 4-5 norms Honor the ground rules created Be ready to share possible norms Decide on norms to get our work accomplished Fewer, synthesized norms will be easier to keep each other on track
DCIT Ground Rules • Be on time, present and focused • Respect each other’s views • Let people explain their point without interruption • Challenge each other gracefully and in love, balancing grace and truth • Maintain confidentiality • Respect integrity of group • Monitor airtime • Everyone is here for a purpose; responsibility for input and output • Come prepared • Recognize that we don’t have all the answers • Voice: everyone in this room has a voice that is no more and no less important than anyone else
Guidelines for DCIT Take a couple of minutes to read structure/ function and guidelines for DCIT
“Will Do, Won’t Do, Let’s Talk” Protocol • Individually using the documents about DCIT, make a list of things you feel we will do and won’t do as part of being a member of DCIT. • Think about your previous experience and what you hope to gain and change about the team. • Then meet with a group of 4 (try to find 1-2 people you do not work with each day). • Make a chart and discuss key will and won’t (s). • Be ready to share out by group.
Does our role as a member change? • After looking at the “Will Do” lists, how does this change our role? • How do we communicate the “Won’t Do” lists?
Processes for DCIT • Making the best use of our time • What can be done to ensure our time is used most effectively? • How can we communicate the learning and the work we do to other staff?
Top To Bottom RankingMDE • http://www.mdoe.state.mi.us/MDEDocuments/TTB/top_to_bottom_top_to_bottom_ranking.html • This is a presentation you might want to view and use with other staff. • The presentation provides many details on the data.
Top to Bottom List • Statewide ranking of ALL schools • Bottom 5% = Priority/PLA schools (starting SY 2012-2013) • Also used for Focus and Reward: • Use achievement gap component only Focus schools • Use top 5% overall Reward schools • Use improvement component only Reward schools
Top to Bottom (TTB) Ranking • Three main components by subject: • Achievement • Improvement in achievement over time • The largest achievement gap between two subgroups calculated based on the top scoring 30% of students versus the bottom scoring 30% of students Each component tells schools something about their overall performance and can be used for diagnostics
TTB Ranking • In addition to the achievement components, student graduation is included in the statewide top-to-bottom ranking for schools with a graduation rate in the two following ways: • Graduation Rate • Improvement in graduation rate over time
Who receives a ranking? Schools with 30+ full academic year (FAY) students over the last two years in at least two state-tested content areas; school must be OPEN at time of list generation Application Some schools do not receive a ranking if they: • Have too few FAY students • Only have one year of data
Tested Grades and Subjects • Reading and Mathematics: Grades 3-8 and 11 • In grades 3-8, testing every year allows us to figure out student performance level change (our current “growth” metric) in reading and math • Students can either significantly improve, improve, maintain, decline or significantly decline • Writing: Grades 4 & 7 • Science: Grades 5 & 8 • Social Studies: Grades 6 & 9
What is a Z-Score? Quick Reference for Z-Scores
Why do We Use Z Scores? • Z-scores are a standardized measure that helps you compare individual student (or school) data to the state average data (average scores across populations). • Z-scores allow us to “level the playing field” across grade levels and subjects • Each Z-score corresponds to a value in a normal distribution. A Z-Score will describe how much a value deviates from the mean. What do you need to know: Z-scores are used throughout the ranking to compare a school’s value on a certain component to the average value across all schools.
Z-SCORE “CHEAT SHEET” • Z-scores are centered around zero • Positive numbers mean the student or school is above the state average • Negative numbers mean the student or school is below the state average State Average …Worse than state average Better than state average…. 1 -3 -2 0 2 3 -1
Z-Score Examples • Your school has a z-score of 1.5. You are better than the state average. Z-score of 1.5 …Worse than state average State Average Better than state average…. 1 -3 -2 0 2 3 -1
Z-Score Examples • Your school has a z-score of .2. You are better than the state average, but not by a lot. Z-score of 0.2 Z-score of 1.5 State Average …Worse than state average Better than state average…. 1 -3 -2 0 2 3 -1
Z-Score Examples • Your school has a z-score of -2.0. You are very far below state average. Z-score of -2.0 Z-score of 0.2 Z-score of 1.5 State Average …Worse than state average Better than state average…. 1 -3 -2 0 2 3 -1
School GroupsPlease take a few minutes to get into the groups listed. • West • Kathleen, Gloria, Michelle, Maria, Susan V • Holland High School • Justin, Mark, Sue, Lynette, Deb, Patsy, John • East • Nery, Lara, Janette, Jamie • Holland Heights • Kevin, Susan W, Jim , Bill, Becky • Jefferson • Rick, Sandy, Greg, Ellen, Carol
How Is the Top to Bottom Ranking Calculated • For grade 3-8 reading and mathematics Two-Year Average Standardized Student Scale (Z) Score School Achievement Z-Score 1/2 Two-Year Average Performance Level Change Index School Performance Level Change Z-Score Content Index Z-score School Content Area Index 1/4 Two-Year Average Bottom 30% - Top 30% Z-Score Gap School Achievement Gap Z-Score 1/4
What is important to show Schools? • For grade 3-8 reading and mathematics Two-Year Average Standardized Student Scale (Z) Score School Achievement Z-Score 1/2 Two-Year Average Performance Level Change Index School Performance Level Change Z-Score Content Index Z-score School Content Area Index 1/4 Step #1: Achievement How well did the school do in that subject? Positive number = better than average Near zero = average Negative number = worse than average Two-Year Average Bottom 30% - Top 30% Z-Score Gap School Achievement Gap Z-Score 1/4
What is important to show Schools? Step #2: Improvement Is the school improving in that subject? Positive number = greater rate of improvement than average Near zero = average improvement Negative = slower rate of improvement than average; can also mean they are declining • For grade 3-8 reading and mathematics Two-Year Average Standardized Student Scale (Z) Score School Achievement Z-Score 1/2 Two-Year Average Performance Level Change Index School Performance Level Change Z-Score Content Index Z-score School Content Area Index 1/4 Two-Year Average Bottom 30% - Top 30% Z-Score Gap School Achievement Gap Z-Score 1/4
What is important to show Schools? Raw value is also meaningful: Positive number: More students improving than declining Negative number: More students declining than improving • For grade 3-8 reading and mathematics Two-Year Average Standardized Student Scale (Z) Score School Achievement Z-Score 1/2 Two-Year Average Performance Level Change Index School Performance Level Change Z-Score Content Index Z-score School Content Area Index 1/4 Two-Year Average Bottom 30% - Top 30% Z-Score Gap School Achievement Gap Z-Score 1/4
What is important to show Schools? Step #3: Achievement Gap Is the gap in that subject between top 30% and bottom 30%: (positive number) = smaller gap than average (negative number) = larger gap than average (near zero) = average gap • For grade 3-8 reading and mathematics Two-Year Average Standardized Student Scale (Z) Score School Achievement Z-Score 1/2 Two-Year Average Performance Level Change Index School Performance Level Change Z-Score Content Index Z-score School Content Area Index 1/4 Two-Year Average Bottom 30% - Top 30% Z-Score Gap School Achievement Gap Z-Score 1/4
What is important to show Schools? • For grade 3-8 reading and mathematics Two-Year Average Standardized Student Scale (Z) Score School Achievement Z-Score 1/2 Reward Schools (for improvement) Two-Year Average Performance Level Change Index School Performance Level Change Z-Score Content Index Z-score School Content Area Index 1/4 Focus Schools Two-Year Average Bottom 30% - Top 30% Z-Score Gap School Achievement Gap Z-Score 1/4
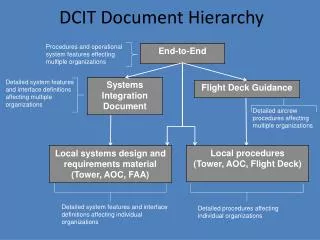
HOW IS THE TOP TO BOTTOM RANKING CALCULATED • Calculating an overall ranking for a school with a graduation rate School Mathematics Std Index 18% School Reading Std Index 18% Overall School Percentile Rank Overall Standardized School Index School Science Std Index 18% School Social Studies Std Index 18% School Writing Std Index 18%%% School Graduation Rate Std Index 10%
HOW IS THE TOP TO BOTTOM RANKING CALCULATED • Calculating an overall ranking for a school without a graduation rate School Mathematics Std Index 20% Look at each subject index. Help schools understand which subjects are strong/weak for them. Positive number: better than average Negative number: below average Near zero: near average School Reading Std Index 20% Overall School Standardized Index Overall School Percentile Rank School Science Std Index 20% School Social Studies Std Index 20% School Writing Std Index 20%
Looking at Each School • Use handout entitled “What is Important to Show Schools?” and discussion questions • Discuss among your school colleagues • Use a huddle board. Take notes. • Share your school’s story • How does this affect our work in DCIT?
Once they have looked at each component, discuss: • What’s the overall pattern? • Low achievement? • Declining achievement? • Large gaps? • Where are the actionable areas? • Which subjects need the most attention? • Is everyone doing poorly (small gap, low achievement) or are some students doing well and others falling behind (decent achievement, but large gap)
School Improvement Plans Taking a look at Professional Development written into the plans You will work in teams by school with other team members You will look at your SIP
School Improvement Plans Work with other members from your school Other staff, please find a group to work with
SIP PD Review • Go to HPS website • Find your school • Find your SIP • Take a few minutes to review with your colleagues • Complete PD chart for each plan • What trends did you see? What problems may arise?
Guaranteed and Viable Curriculum • Ranked as #1 school level factor (Marzano, Lezotte, Edmonds) • Guaranteed, viable curriculum is cornerstone of rigor • Impossible to raise and maintain high achievement levels without Guaranteed, Viable curriculum • Greatest impact on student achievement, more than programs or materials • Focus on differences between intended and implemented (must have it in place first) • Road map for principals’ to support teaching and learning • Will allow conversation around teaching and learning
Video on Curriculum • http://www.youtube.com/watch?v=2IGTjrYOUYE
What is curriculum? • Thoughts? • More than a textbook or series • These are essential resources • A curriculum should lay out what is to be taught, how and how it will be assessed • Intended • Implemented • Tested
What is the difference between a curriculum and a resource? • A textbook is a book on a specific topic, like biology. • A curriculum is what is contained in the courses, the materials to be covered, what tests and books will be used by a school. It can also apply to the materials to be covered in a particular field of study, such as biology.
Mapping to Content • Content is CCSS • Includes use of text or other resources • Not only text or resources • We should be able to teach without the text….does not mean we want to or should but we could. • Books should be listed but where in map?
Curriculum Audit Groups • Kindergarten- Ellen, Carol, Gloria • 1st- Maria, Deb • 2nd - Michelle, Nery, Phil • 3rd- Lynette, Jim • 4th- Becky, Lara, Kevin • 5th- Bill, Sandy V, Rick, Suzanne W • 6th- Mark, Patsy, Kathleen, Susanne V • 7th- Sue, John, Greg, Jamie
Auditing Curriculum Maps • In assigned groups • Work on grade level maps • Maps are located on HPS School Improvement Site • Complete an audit form for each content by grade level • Provide input
Trends from curriculum Auditing Process • What trends did you see? • What does this mean for our next step? • How do we ensure secondary classes that are commonly taught have a articulated curriculum?
Informational Items Details, details, details
DCIT Meeting Dates 2012-13 • Nov. 6…..3:30-5:30 p.m. • Dec. 4…..12-3:00 p.m. • Jan. 16….12-3:00 p.m. • Jan. 29….3:30-5:30 p.m. • Feb. 12….12-3:00 p.m. • March 5….3:30-5:30 p.m. • March 19….12-3:00 p.m. • April 16….12-3:00 p.m. • May 14….12-3:00 p.m. • May 21….3:30-5:30 p.m.
Finding the Professional Staff Development Form www.hollandpublicschools.org
On-Site Review What is it? Does it apply to my school/program? Yes!
Consolidated programs • Title I • Title II a • Title III • At-Risk/31 A • All HPS buildings receive funding/services from some or all programs listed above