Download
1 / 31
310 likes | 529 Vues
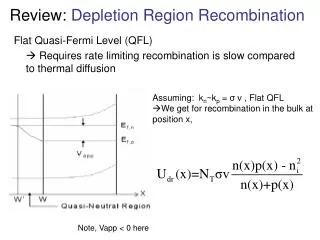
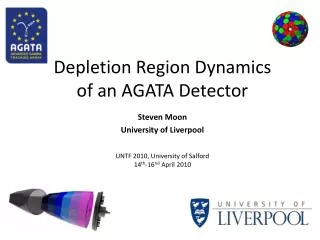
Depletion Region Dynamics of an AGATA Detector. Steven Moon University of Liverpool. UNTF 2010, University of Salford 14 th -16 nd April 2010. • Overview. Background What is AGATA? Gamma Ray Tracking Pulse Shape Analysis Case for AGATA Role of the University of Liverpool AGATA Group

E N D
Depletion Region Dynamics of an AGATA Detector Steven Moon University of Liverpool UNTF 2010, University of Salford 14th-16nd April 2010
• Overview • Background • What is AGATA? • Gamma Ray Tracking • Pulse Shape Analysis • Case for AGATA • Role of the University of Liverpool AGATA Group • Characterisation of AGATA detectors • Scan modes • Experimental setup
• Overview (cont.) • Some Scan Results • Experimental • Simulated • Experimental vs Simulated • Next Steps....
• Background - What is AGATA? • AGATA – Advanced GAmmaTracking Array • 180 Coaxial HPGe Detectors, tapered to asymmetric hexagonal end → 36-fold Segmentation • 3 types of AGATA detector (all asymmetric) • RED most asymmetric • GREEN • BLUE least asymmetric • Arranged into ‘ball’, i.e. 4π ‘Spherical Honeycomb’ structure, around beam-target interaction position • Final array will consist of 60 ‘Triple-clusters’ 6 5 4 3 D 2 C E 1 F B A (Images adapted from M. R. Dimmock, PhD Thesis, 2008)
• Background – Established technology • Established technology → Compton Suppression • Currently in use in facilities world wide → e.g. GAMMASPHERE @ ANL, USA • Good, but not that good.... → discards many valuable events → Only accept events occurring completely within single HPGe detector volume....
• Background – Gamma-Ray Tracking • Next-generation technology → Gamma-Ray Tracking θ ɣ-ray Source
• Background – Pulse Shape Analysis • To accurately obtain θ, need accurate interaction positions... → Pulse Shape Analysis → Use core and segment charge pulses to determine (x, y, z) of interaction → Core and segment pulses give a unique ‘fingerprint’ for a given interaction position 1 2 2 ns samples (Images adapted from C. Unsworth, Private Comm., 2010)
• Background – Case for AGATA • Compared to current arrays, AGATA will: • Dramatically increase access to weakest signals from exotic nuclear events → up to factor of ≈1000 improvement in sensitivity → allow access to unseen channels in previously studied reactions • Complement new RIB facilities → Smaller reaction cross-sections → Higher levels of background
• Role of the UoL AGATA Group • Different aspects of AGATA project handled by different institutions across Europe • University of Liverpool AGATA Group: → Characterisation & Acceptance Testing • Scan AGATA detectors using various techniques • 137Cs Coincidence Scans • 137Cs Singles Scans • Front-face → Front-face Bias • Side • Aim is to provide confidence in Electric Field Simulations of AGATA detectors
• Experimental Setup • Acquire in singles mode using mono-energetic 137Cs source • Scan detector on 2mm2 grid @ 30s per scan position • Demand fold-1 (i.e. 1 hit seg.) events of full (662keV 137Cs) energy (Image adapted from M. R. Dimmock, PhD Thesis, 2008)
• Results • Examine detected gamma-ray intensity (for Rings 1-6) at each x-y scan position • Repeat for various HV Bias Voltages (4500V, 4000V, 3000V, 2000V, 1500V, 1000V, 750V, 500V, 250V, 100V, 50V) • Compress 2mm scan data
• Results (cont.) • Compare intensities to those at full (4500V) bias...
• MGS Simulations • Detector simulated for all experimental bias voltages using MGS (Multi-Geometry Simulation) • Impurity concentrations (supplied by Canberra) - Front: 0.65 x 10⁻¹⁰ cm-3 - Back: 1.4 x 10⁻¹⁰ cm-3 • Image results in similar fashion...
• MGS Simulations (cont.) Detector at 4000V 100% depleted
• MGS Simulations (cont.) Detector at 3000V 94.8% depleted
• MGS Simulations (cont.) Detector at 2000V 76.6% depleted
• MGS Simulations (cont.) Detector at 1500V 62.2% depleted
• MGS Simulations (cont.) Detector at 1000V 44.0% depleted
• MGS Simulations (cont.) Detector at 750V 33.8% depleted
• MGS Simulations (cont.) Detector at 500V 22.6% depleted
• MGS Simulations (cont.) Detector at 250V 10.4% depleted
• MGS Simulations (cont.) Detector at 100V 1.7% depleted
• MGS Simulations (cont.) Detector at 50V 0.3% depleted
• Next Steps • Continue comparison of experimentally derived depletion volumes and MGS simulation • Compare experimental & simulated pulse shapes • Compare with other depletion simulations (e.g. using JASS, Maxwell 3D) • Compare with other measurements, e.g. C-V measurements conducted at University of Cologne (B. Birkenbach & B. Bruyneel, to be published) Does this method of scanning allow a practicable derivation of the crystal impurity concentration?
Questions & Comments... Steven Moon1, D. Barrientos2, A.J. Boston1, H. Boston1, S.J. Colosimo1, J. Cresswell1, D.S. Judson1 P.J. Nolan1, C. Unsworth1 1Department of Physics, University of Liverpool, Liverpool, L69 7ZE, UK 2Laboratorio de Radiaciones Ionizantes, Universidad de Salamanca, 37008 Salamanca, Spain
• Background – Compton Suppression Positive Core • Established technology → Compton Suppression HPGe Detector Volume BGO Shielding ɣ-ray Source
• Background – Compton Suppression • Established technology → Compton Suppression • GAMMASPHERE @ Argonne N.L., USA • JUROGAM @ Uni. of Jyvaskyla, Finland → Only accept events occurring completely within HPGe detector volume....
• Experimental Setup (cont.) • Repeat for various HV Bias Voltages (4500V, 4000V, 3000V, 2000V, 1500V, 1000V, 750V, 500V, 250V, 100V, 50V) Core Energy at Varying Bias Voltage