Download
1 / 35
350 likes | 440 Vues
Explore economic indicators like GDP, debt ratios, and commodity prices to gauge implications for agricultural lending. Key insights shared by Mark Pearson at the Independent Community Bankers event in Nashville. Stay informed about trends shaping the financial landscape.

E N D
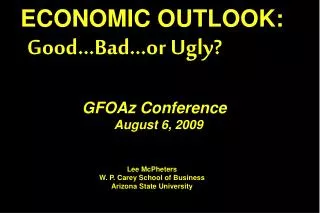
ECONOMIC OUTLOOK: IMPLICATIONS FOR AG LENDERS Remarks by Mark Pearson Independent Community Bankers Nashville, Tennessee March 12, 2012
Gross Fed. Debt FY-1900 to FY-2016 Source: usgovernmentspending.com
U.S. National Debt Source: U.S. Treasury, CBO
Thoughts on the World Economy • $71.25 trillion – Global GDP • $14.89 trillion – EU GDP • $14.72 trillion – U.S. GDP • $9.87 trillion – China GDP • $4.33 trillion – Japan GDP • $4.04 trillion – India GDP Source: CIA Factbook
U.S. GDP – FY2004-FY2014 Source: usgovernmentspending.com
WorldReal GDP Growth 1980-2013 Source: Int’l Monetary Fund
U.S. Consumer Confidence Source: University of Michigan
New Housing Starts Source: U.S. Census of Bureau
Manufacturers’ New Orders 2010-11 Source: U.S. Census Bureau
DJIA Five-Year Performance Source: finance.yahoo.com
10-Year Treasury Note Yield Source: finance.yahoo.com
Five-YearU.S. Dollar Index Source: NYBOT
Five-Year Gold Prices Source: kitco.com
10-Year Prime Rate Source: MoneyCafe.com
Inflation Adjusted Farmland Values 1964-2010 Source: Chicago Federal Reserve
d Repayment Capacity 1970-2011 Source: ERS, USDA
Farm Sector Debt Ratios 1970-2011 Source: ERS, USDA
d FarmSector Equity 1970-2011 Source: ERS, USDA
Farm Sector Business Debt 1970-2011 Source: ERS, USDA
Light Sweet Crude Oil Source: NYMEX
China’s Total Primary Energy Consumption, 1970-2020 Source: Int’l Energy Outlook
China’s Demand for Oil Imports Source: Int’l Energy Outlook
China Flex Its Military Muscles Source: Defencetalk.com
Vital Maritime Chokepoints Source: EIA
Projected World Population 2050 Source: U.S. Census Bureau
World Population Growth Rate Source: CIA Factbook
“Youth Bulge” Population Impact 300 250 200 150 100 50 25 0 Millions 292.2 Afghanistan 240.3 Iran 158.1 100.2 91.2 Pakistan 79.4 69.4 53.3 25.1 2005 2030 2050 Source: Stanford Center for Longevity
Median Age in Mideast Hot Spots 41 Afghanistan 36 34 Iran 28 23 23 Pakistan 18 20 16 2005 2030 2050 Source: Stanford Center for Longevity
10-Year Corn Prices Source: NASS
10-Year Soybean Prices Source: NASS
10-Year Wheat Prices Source: NASS
10-Year Cattle Prices Source: NASS
10-Year Hog Prices Source: NASS
10-Year Cotton Prices Source: NASS