Download
1 / 45
470 likes | 648 Vues
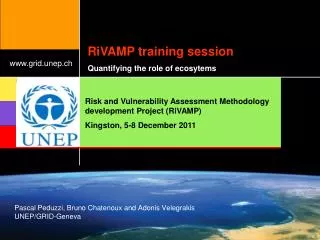
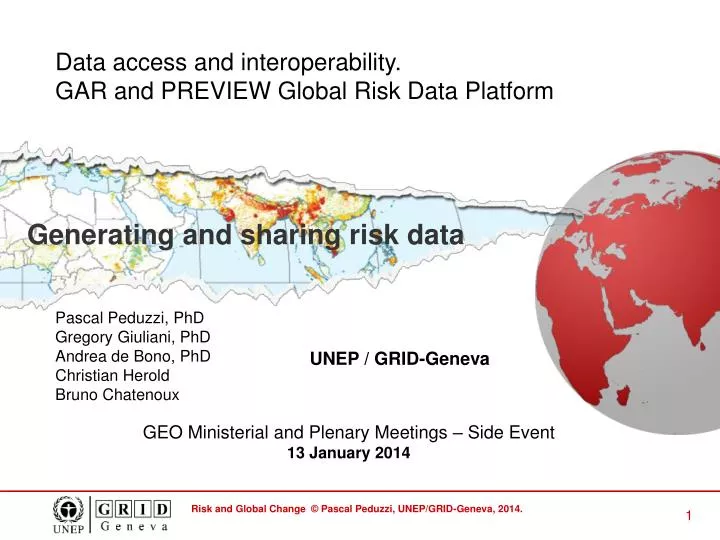
Data access and interoperability. GAR and PREVIEW Global Risk Data Platform. Generating and sharing risk data. Pascal Peduzzi, PhD Gregory Giuliani, PhD Andrea de Bono, PhD Christian Herold Bruno Chatenoux. UNEP / GRID-Geneva. GEO Ministerial and Plenary Meetings – Side Event

E N D
Data access and interoperability. GAR and PREVIEW Global Risk Data Platform Generating and sharing risk data Pascal Peduzzi, PhD Gregory Giuliani, PhD Andrea de Bono, PhD Christian Herold Bruno Chatenoux UNEP / GRID-Geneva GEO Ministerial and Plenary Meetings – Side Event 13 January 2014
Who are we? Global level risk analysis The PREVIEW Global Risk Data Platform GAR 2013: new developments Presentation plan
University of Geneva B. Chatenoux Dr A. De Bono C.Herold Dr G.Giuliani Dr P. Peduzzi Global Change & Vulnerability Unit Global Change & Vulnerability: a unit of the UNEP/GRID-Europe UNEP DEWA DEWA DEPI DTIE DRC DCPI DGEF UNEP/GRID-Geneva SwissEnv. Agency Global Change & Vulnerability Unit (ex Early Warning)
Data (SDI) Field data collection Image analysis Statistical analysis Maps & Info PREVIEW Global Change & Vulnerability Unit Spatial analysis (GIS)
2006 2006 Contribution to 12 UN reports on risk & global change 2004 2007 2005 G R 2008 A 2009 2010 2013 + 28 Scientific papers 2011 2012
How to generate risk data Vulnerability ClimateEnvironment DEVELOPMENT Natural variability Disaster RiskManagement Hazards DISASTERRISK AnthropogenicChanges Adaptation Exposure Disaster GHG emissions, deforestation,…
New Global Hazard Datasets created for GAR 2009 Tectonic Hazards 9
New Human & Economic exposure datasets (1 x 1 km Population and GDP distribution Models made for every years from 1970 to 2010 10
Compilation of Past Earthquakes ShakeMaps 5686 events downloaded over the period 1973-2007 12
Individual past hazardous events modeling >6000 tropical cyclones events were processed Global coverage for the period 1970 to 2012. Using central pressure Maximum windspeed Latitude … 14
Extraction of exposure and other parameters Nargis 2 May 2008 Myanmar 15
Preview Tropical Cyclones Database VulnerabilityDatabase 43 indicators EM-DAT, CRED Database Pop.Urb exp. GDP Urb. exp … GDP exp. Footprints Category Pop. exp. 1 10,500,000 43,000,000 4,800,000 32,500,000 2 3,500,000 1,400,000 525,000 1,500,000 3 800,000 375,000 150,000 400,000 Country: Myanmar Iso3: MMR Date: 02 May 2008 Date Iso3 Date Iso3 GDPcap Voice & acc. Governance efficiency Radio/inhabitant HDI … Urban growth Date Iso3 Killed Est. damages Killed: 138,366 Damages: 4,000 US$ millions GDPcap: 1,227 US$ Voice & acc.: -2.16 Governance efficiency : -1.608 Radio/inhabitant: 99.68% HDI: 0.592 … Urban growth: 2.55% 16
List of vulnerability parameters considered 43 indicators on: Economy, Demography, Environment, Development, Early Warning, Governance, Health, Education, … 17
Landslides (modelled for both precipitation and earthquakes) About 2.2 million people are exposed to landslides worldwide. 55% of mortality risk is concentrated in 10 countries, which also account for 80% of the exposure. Comoros, Dominica, Nepal, Guatemala, Papua New Guinea, Solomon Islands, Sao Tome and Principe, Indonesia, Ethiopia, and the Philippines 22
Tropical cyclones risk Multiple Risk 23
Earthquakes Mortality Risk Index (MRI) Cyclones Mortality Risk Index (MRI) Floods Mortality Risk Index (MRI) Landslides Mortality Risk Index (MRI) 25
The Global Risk Data Platform Used by: in GEOSS portal UNEP UNISDR (For GAR). World BankUNHCR Inform (EU/JRC) WRI (UNU) OCHA Mapplecroft And many others Users can visualise, interrogate, download data related to disaster risk (hazard, exposure, risk). http:// preview.grid.unep.ch
Fully Open Source • OGC & ISO compliant • Based on: • PostgreSQL/PostGIS, • PHP, • Geoserver, • GeoNetwork, • OpenLayers & GeoExt. • Analysis of geospatial data: ESRI ArcInfo & ArcGIS GEO-X: Disasters Risk Reduction and Earth Observations, a GEO perspective - 13.01.2014 28
~220’000 visitors ~3’200’000 pages ~7’100’000 maps produced ~300 GB of data downloaded Access x4 after Sichuan and Haiti events Access x10 after Fukushima GEO-X: Disasters Risk Reduction and Earth Observations, a GEO perspective - 13.01.2014 29
PreView Mobile http://preview.grid.unep.ch/mobile Web-based Multiplatform Access all layers in WMS Search location: GeoNames GPS Zoom IN/OUT, Pan Multi-touch control GEO-X: Disasters Risk Reduction and Earth Observations, a GEO perspective - 13.01.2014 30
GEO-X: Disasters Risk Reduction and Earth Observations, a GEO perspective - 13.01.2014 31
GAR 2009-2011 probabilistic approach? Based on 1960 – 2000 precipitations Drought Based on 100 years returning period Floods Based on 1970 – 2009 detected events Trop. Cyclones Landslides (Pr) Based on 1960 – 2000 precipitations Tsunamis Based on GSHAP 1:475 years Based on 1997 – 2010 detected events Forest fires Yes No CC. Remarque Based on GSHAP 1:475 years Earthquakes Based on GSHAP 1:475 years Landslides (Eq)
GAR 2013: probabilistic approach ? Yes No CC. Remarque Based on FEWS methodology (6 countries) Drought Based on GEM Earthquakes Based on 5 different returning periods Floods Based on synthetic tracks and stochastic approachone global estimation of climate change impacts Trop. Cyclones Based on GSHAP 1:475 years Landslides (Eq) Landslides (Pr) Based on 1960 – 2000 precipitations Tsunamis Based on GSHAP 1:475 years Based on burnt areas 2000 - 2011 Forest fires
Hazards: GAR 2015 Yes No CC. Remarque Based on FEWS methodology, more countries Drought Based on GEM Earthquakes Based on 5 different returning periods Floods Based on synthetic tracks and stochastic approach Trop. Cyclones Based on GEM Landslides (Eq) Landslides (Pr) Based on stochastic approach Tsunamis Not yet discussed Forest fires
2.4 Tropical cyclones global trends Peduzzi, P., Chatenoux, B., Dao, H., De Bono, A., Herold, C., Kossin, J., Mouton, F., Nordbeck, O. (2012) Tropical cyclones: global trends in human exposure, vulnerability and risk, Nature Climate Change, 2, 289–294.
Scenarios on TC for 2030 As adapted from Knutson et al. (2010)
Global Flood Model NEW GLOBAL FLOOD MODEL 5 returning periods NEW GLOBAL FLOOD MODEL 5 returning periods
NEW GLOBAL FLOOD MODEL 5 returning periods NEW GLOBAL FLOOD MODEL 5 returning periods
Outputs GED - GLOBAL EXPOSURE MODEL GAR13 GED 2013 (Global Exposure Database): each record (exposed value) represents a certain building structural type of certain income level/sector in a certain urban area with a special point representation in the centroid of the 5x5 cell. Capital stock distribution on a 5x5 km grid: map shows aggregate values for resident buildings.
GAR 2013 / 2015 A GEDGlobal Exposure Model GAR13 Andrea de Bono (GRID) Miguel Mora (CIMNE)
GED Thematic components GED - GLOBAL EXPOSURE MODEL GAR13 People living in urban areas Income, employment, health, education Built-environment Building structure class (WAPMERR) Produced capital and urban land
Built-environment and urban population GED - GLOBAL EXPOSURE MODEL GAR13 Built-environment 1 4) populate “urban areas” extract Urban areas mask: from remote sensing (MODIS 500m) Population: number people per cell (Source Landscan) Urban population: nb. people per cell
Capital stock estimation GED - GLOBAL EXPOSURE MODEL GAR13 We use the World Bank’s “comprehensive wealth” methodology*. •Produced Capital using the Perpetual Inventory Method for machinery and structures, based on Gross Capital Formation data, and layers on urban land as a proportion of this. GAR 2013 * World Bank (2011). The changing wealth of nations : measuring sustainable development in the new millennium Capital stock data are at national level. The downscaling to cell is done using GDP at subnational scale as proxy
Than you http://www.grid.unep.ch/GCV http://preview.grid.unep.ch