Reading Synoptic Charts
Learn how synoptic charts depict atmospheric conditions for weather forecasting, including air pressure, wind speed, and direction. Understand cold fronts, warm fronts, and troughs in this guide.

Reading Synoptic Charts
E N D
Presentation Transcript
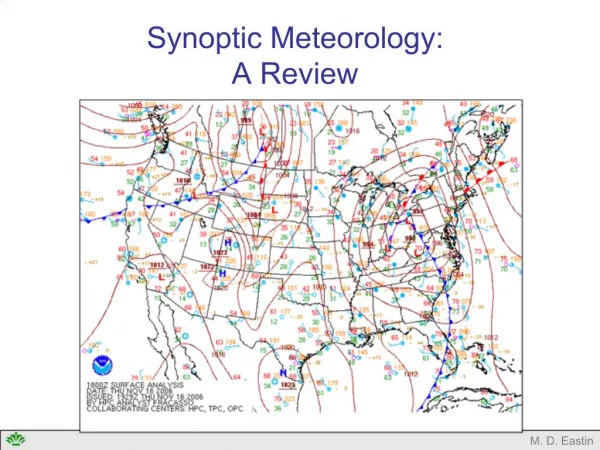
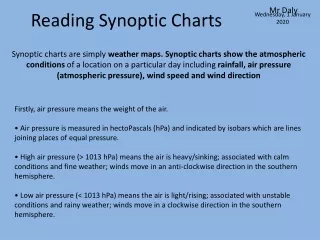
Mr Daly Reading Synoptic Charts Wednesday, 1 January 2020 Synoptic charts are simply weather maps. Synoptic charts show the atmospheric conditions of a location on a particular day including rainfall, air pressure (atmospheric pressure), wind speed and wind direction Firstly, air pressure means the weight of the air. • Air pressure is measured in hectoPascals (hPa) and indicated by isobars which are lines joining places of equal pressure. • High air pressure (> 1013 hPa) means the air is heavy/sinking; associated with calm conditions and fine weather; winds move in an anti-clockwise direction in the southern hemisphere. • Low air pressure (< 1013 hPa) means the air is light/rising; associated with unstable conditions and rainy weather; winds move in a clockwise direction in the southern hemisphere.
Big spaces between isobars means slow to no winds Small spaces between isobars means fast and strong winds A Trough is were air is unstable, and has both cold and hot air mixing Cold Front (Cold Wind) Hot Front (Hot Wind) Cold air movesanti clockwise Hot air movesclockwise
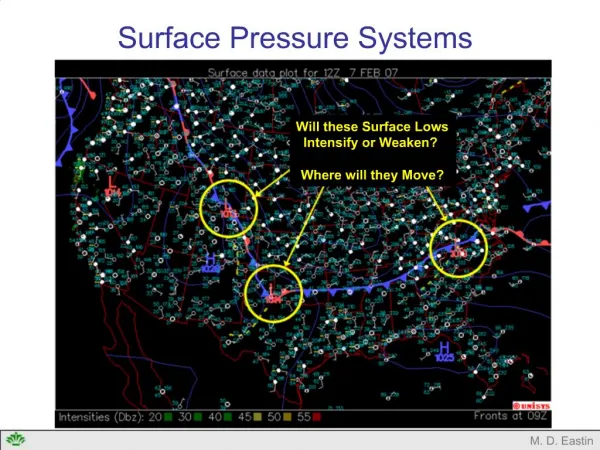
Mr Daly Reading Synoptic Charts Wednesday, 1 January 2020 • A front is the boundary between two air masses. • A cold front is when a mass of cold air moves towards a mass of warm air pushing it upwards and is indicated by a line with spikes (think of freezing cold icicles); generally brings north or north west wind and a drop in pressure leading to falling temperatures, wind and rain but this depends on the actual temperature and water content of the air masses, which depend on the region over which the air masses originate. • A warm front is when a mass of warm air moves towards a mass of cold air pushing it downwards and is indicated by a line with bumps (think of melting icicles); moves at half the speed of a cold front; warm fronts generally occur in high latitudes and are not common in Australia. • A trough is an elongated area of low pressure extending out from the centre of the pressure system.