
Uploaded by
chaim
0 SLIDES
168 VUES
0LIKES
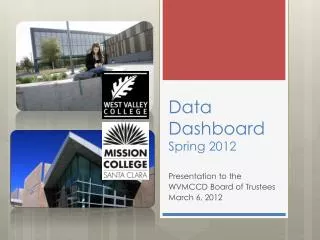
COM Data Dashboard
DESCRIPTION
COM Data Dashboard. Planning, Research and Institutional Effectiveness. What is COM Data Dashboard. Contains research and statistics on: -Student Demographics Student Enrollment -Student Achievement Course Retention Course Success Cohort Tracking Student Persistence
Download

1 / 0
Download Presentation

Télécharger la présentation
COM Data Dashboard
An Image/Link below is provided (as is) to download presentation
Download Policy: Content on the Website is provided to you AS IS for your information and personal use and may not be sold / licensed / shared on other websites without getting consent from its author.
Content is provided to you AS IS for your information and personal use only.
Download presentation by click this link.
While downloading, if for some reason you are not able to download a presentation, the publisher may have deleted the file from their server.
During download, if you can't get a presentation, the file might be deleted by the publisher.
E N D
Presentation Transcript
-
COM Data Dashboard
Planning, Research and Institutional Effectiveness - What is COM Data Dashboard Contains research and statistics on: -Student Demographics Student Enrollment -Student Achievement Course Retention Course Success Cohort Tracking Student Persistence Degrees/Certificates Awards Program Review
- How can Data Dashboard be used?Examples The Data Dashboard contains demographic data and passing rates for courses at College of Marin, and is accessible through the intranet. Data Dashboard can permit a snapshot of which students are enrolled in the course so that instructors can be aware of instructional modifications they may wish to make to maximize effectiveness. The Dashboard can also be used to encourage data-driven discussion among instructors around reaching particular groups of students.
- Limitations Live data (as of this moment) Waiting time Access on Campus network only
- Access to ARGOS/Dashboard ARGOS account COM intranet
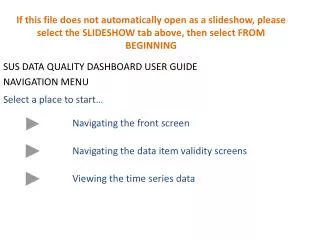
- 1: Select term(s) 2: Click on the black dot 3: Results of chart dimension 4: change chart dimension
- 2: Click here to execute 1: Select term(s) 3: Results of enrollment
- 1: Select term(s) 2: Click here to execute 3: Results of course success
- 1: Select start term and end term 2: Select Subject and Course for the start term 5: Select Subject and Course for the end term 3: Click on “Show Column One” to execute 6: Click on “Show Column Two” to execute 7: Results of Cohort Tracking 4: Results of Cohort Tracking
- Tips and Tricks Open the Hidden Information Multiple Selections Hold “Control” and make selection Hold “Shift” and make selection
- Practice Pick one page Follow the direction: step 1, step 2, … Then click around and play
- Feedback What works? What changes are needed? What can we improve? Suggestions?
- Agenda What is COM Data Dashboard Access to ARGOS/Dashboard Demo Practice Feedback
-
COM Data Dashboard
Planning, Research and Institutional Effectiveness December 15, 2011


More Related
Audio
Live Player