EEC Performance Measurement Data Dashboard
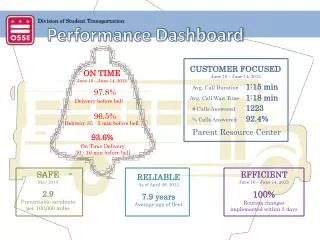
EEC Performance Measurement Data Dashboard. Using performance measures to drive results – April 2013. EEC Performance Measurement. Developing and Using the EEC Dashboard. Agency/EEC Board Devises Performance Metrics. Dashboard makes Data Visible. EEC targets actions that improve performance.

EEC Performance Measurement Data Dashboard
E N D
Presentation Transcript
EEC Performance Measurement Data Dashboard Using performance measures to drive results – April 2013
Developing and Using the EEC Dashboard • Agency/EEC Board Devises Performance Metrics • Dashboard makes Data Visible • EEC targets actions that improve performance Use Dashboard to Enhance Performance • Allows leadership to make informed decisions • Shows results and progress against metrics
So, What Do We Track? • Just about everything! Program data Licensing data Professional Qualifications data Fiscal data Child demographics data RTTT reports Legislative reports The key is highlighting relevant data in a simple and easy to understand way
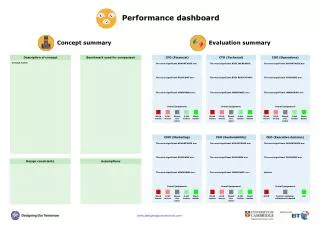
Create a Compelling Dashboard • Visual representation effectively communicates: • 1. where are we now? • 2. where do we want to be? • 3. when do we need to be there?
Performance Measurement Categories • Access • Number of children on the Waitlist for subsidized care • Average length of time on Waitlist prior to enrollment • New children on Waitlist versus enrolled per month • Available child care slots compared to number of children needing care • Quality – Quality Rating and Improvement System (QRIS) • Percentage of programs in QRIS • Percentage of programs in QRIS level 2 and higher • Percentage of programs receiving subsidy in QRIS • Percentage of subsidized children served in high quality programs
Access - Number of children on the Waitlist for subsidized care What is the average increase monthly? 1525
Access - Average length of time to wait prior to enrollment Once access is re-opened waitlist duration is expected to decrease
Access – New Children on Waitlist vs. Children Enrolled Per Month
Access - Available child care slots compared to number of children needing care • Available child care slots compared to number of children needing care • Under development • When filling Contract Slots age group and location are taken into consideration
Quality - Percentage of programs in QRIS that receive subsidies
Quality - Percentage of subsidized children served in high quality programs
Conclusions • What other metrics are relevant to EEC for inclusion in a dashboard view? • Licensing metrics • Licensing visits ratios • Educator metrics • Educator credential metrics • Using Performance Measurement as a part of EEC’s Risk Management initiative • Follow up at Policy Committee Meeting