Download
1 / 44
440 likes | 667 Vues
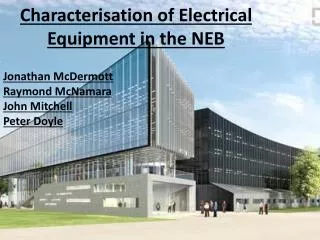
Jonathan McDermott Raymond McNamara John Mitchell Peter Doyle. Characterisation of Electrical Equipment in the NEB. Introduction. The Engineering Building is instrumented throughout with electrical power sensors.

E N D
Jonathan McDermott Raymond McNamara John Mitchell Peter Doyle Characterisation of Electrical Equipment in the NEB
Introduction The Engineering Building is instrumented throughout with electrical power sensors. These sensors show the live performance of the building which help us describe the technical detail of the different electrical loads within the building. The data is accessible through the website http://engbm.srv.nuigalway.ie/ where a wide range of parameters can be selected, for calculations, graph creation and analytic purposes.
The Atrium Lighting Our goal was to analyse the atrium lighting electrical load. Our aims : • Describe the technical detail of this load and relate it to the functionality of the new engineering building . • Describe power supply requirements • Power consumption • Power quality issues.
Topics Covered Jonathan: Calculated power vs. measured power comparison for phase A , B, C. Raymond: 3 phase voltage & current waveform when the atrium is at (i)full load (ii)light load. The corresponding, voltage, current, power & power factor. John: Analysis of graphs and trends, relating them to the function of the building. Research into lighting technology used and investigation into possible improvements. Peter: Cost of energy to supply the atrium over a typical week from different suppliers and sources.
Calculated Power vs. Measured Power We aimed to produce plots of power consumption (KW), for a typical working week (7th Oct. 2011 – 14th Oct. 2011), for each phase of the load. These graphs can help us relate the use of power within the atrium to the function of the building. From the online Web Reach facility we were able to graph the Power (KW). We compared this measured graph against a graph using calculated figures to find power. V*I*cos(phi) Where cos(phi) = power factor.
A closer look We notice a change in the power use of the building during the working week and weekend periods. It can be seen that where calculated power toggles between zero and higher values, the measure power takes the average peak power over these small time periods.
Accuracy of Measured Power? Since the measured power was taken as an average over some time periods, we did a simple test to measure the installed meters power readings vs. the calculated power readings. A random time for each phase was selected and the difference between measured power and the corresponding calculated power reading were calculated. Phase B Phase A Phase C
Ib = 27.45 < -252.82 ˚ 3-Phase Voltage and Current for a 15 minute period 13th Oct 2011 12pm Vc = 238.42 < -240 ˚ 12.82˚ Current lags voltage by 12.82 ˚ degrees Va = 237.35 < 0˚ Ic = 20.64 < -132.82 ˚ Ia = 23.74 < -12.82˚ • (P) Real Power = • 5494.2W (Phase A) • 6388.9W (Phase B) • 4763.5W (Phase C) • (Q) Reactive Power = • 1250.3VAR (Phase A) • 1425.7VAR (Phase B) • 1234.7VAR (Phase C) Signed Power Factor = -97.50 • (Z) Impedance = • 10ohms < 12.82 ˚ (Phase A) • 8.69ohms < 132.82 ˚ (Phase B) • 11.6ohms < 252.82 ˚ (Phase C) Vb = 238.47 < -120 ˚
Example Calculations Phase A on 13th Oct 2011 12pm Current -> 23.74(A) Voltage(in) -> 237.35(V) Power Factor (signed) -> -0.975 Calculations: Reference Voltage Phasor V= 237.35< 0˚ Current lags Voltage by: arcCos (0.975) = 12.82˚ I = 23.74 < (- 12.82˚) S=VI* -> 5634.69<12.82˚ • 5634.69[cos(12.82˚)+ jSin(12.82˚)] • S = 5634.69 + j1250.27 Real Power (P) : 5494.23 W Reactive Power (Q) : 1250.27 VAr Impedance = V/I • 10.0< 12.82˚
Ic = 23.62 < -251.186 ˚ 3-Phase Voltage and Current for maximum load (Maximum Real Power(kW)) Vc = 236.41 < -240 ˚ 12th Oct 2011 5.45am Current lags voltage by 11.186 degrees Va = 235.74 < 0˚ Ib = 30.43 < -131.186 ˚ Ia = 26.71 < -11.186˚ Signed Power Factor = -98.10 • (P) Real Power = • 6167.3W (Phase A) • 7091.9W (Phase B) • 5472.3W (Phase C) • (Q) Reactive Power = • 1220.9VAR (Phase A) • 1402.5VAR (Phase B) • 1083.3VAR (Phase C) • (Z) Impedance = • 8.83ohms < 11.187 ˚ (Phase A) • 7.81ohms < 131.187 ˚ (Phase B) • 10ohms < 251.187 ˚ (Phase C) Vb = 237.57 < -120 ˚
Ic = 0.62 < -267.13 ˚ 3-Phase Voltage and Current for minimum load (Minimum Real Power(kW)) Vc = 236.06 < -240 ˚ 8th Oct 2011 12.15am Current lags Voltage by 27.13 degrees 27.13˚ Va = 235.2 < 0˚ Ia = 0.74 < -27.13˚ Ib = 0.59 < -147.13 ˚ Signed Power Factor = -89.0 • (P) Real Power = • 154.9W (Phase A) • 124.4W (Phase B) • 130.3W (Phase C) • (Q) Reactive Power = • 80.1VAR (Phase A) • 63.8VAR (Phase B) • 66.7VAR (Phase C) Vb = 236.97 < -120 ˚ • (Z) Impedance = • 317.84ohms < 27.13 ˚ (Phase A) • 401.64ohms < 147.13 ˚ (Phase B) • 380.8ohms < 267.13 ˚ (Phase C)
Differences Between Max Power and Minimum Power Phase (A) Reasoning for the Differences The Voltage remains the same but the current(minimum) is obviously less due to lack of power needed Less Power used(min) due to less load on the system Same again but reactive power this time. Nearly proportional to real power Lagging Current with an angle of 90degrees has a power factor of 0 and as you increase to 1 the power factor rises until it hits 0.. V/I with phasor angles gives us these answers: Current(min) way less due to lack of current in the system. • Max Power • Va= 235.74 < 0˚ • Ia = 26.71 < -11.186˚ • Calculated Real Power = 6167.3W • Calculated Reactive Power = 1220.9W • Current Lagging Angle(Va@0 ˚)= • -11.186 ˚ • Impedance(Va@0 ˚) = 8.8277ohms Minimum Power Va = 235.2 < 0˚ Ia= 0.74 < -27.13˚ Calculated Real Power = 154.9W Calculated Reactive Power = 63.75W Current Lagging Angle(Va@0 ˚)= -27.13 ˚ Impedance(Va@0 ˚) = 317.84ohms
Power Factor and its Effect on a System • Power factors below 1.0 require a utility to generate more than the minimum volt-amperes necessary to supply the real power (watts). • This increases generation and transmission costs. • For example, if the load power factor were as low as 0.7, the apparent power would be 1.4 times the real power used by the load. • Line current in the circuit would also be 1.4 times the current required at 1.0 power factor, so the losses in the circuit would be doubled (since they are proportional to the square of the current). • Alternatively all components of the system such as generators, conductors, transformers, and switchgear would be increased in size (and cost) to carry the extra current.
Peak High = 16.34% Peak Low = 0.24% Average = 2.85%
Weekend Period • Thursday appears to maintain a higher level of usage than other weekdays. • A clear and obvious trend appears when we look at this weekly plot of the phase a power consumption data. • The weekend period has a drastically reduced power consumption due to the reduced usage of building, with no lectures being held and the canteen being closed.
Looking at the Met Eireann data for the weather on that particular Thursday we see that there was only 2 hours of sunlight that day, this was more then likely the reason for the elevated energy usage earlier in the day on this date.
Comparing this to a week in early September, we see much narrower rises in consumption. This indicates fewer hours of high usage of the atrium lights. • This is due to the level of natural light controlling how long the lights stay on for and their intensity.
September and October, with warmer temperatures and less rain being observed in September. • These findings are consistent with the comparative weather data for the 2 months.
Weekly Data for Phase A,B,C 7/10/2011 – 14/10/2011 KW • An even and constant distribution between the 3 phases can be seen when we look at the weekly power consumption in terms of kW
Cleaners • for a weekday. • Tuesday the 11th gives us a good idea of the normal power consumption • The initial rise in consumption is just after 5am, the time at which the cleaners do their work for 45mins to an hour, this is an example of the manual override capabilities of the building. • As students begin to arrive between 8.15 and 9am there is a gradual. • Between the hours of 9am and 6pm consumption is constant before it drops as lectures finish . • Between 6.45 and 7.15pm students return to college and consumption is elevated due to the lack of natural light at this time and the lights subsequently needing to be on constantly.
Weekly Data for Phase A,B,C 7/10/2011 – 14/10/2011 KVA
Brief: Atrium Lights Energy Consumption To calculate the total cost of energy needed to supply the Atrium Lights over a typical working week from: (i) 2 commercial suppliers, (ii) CHP, (iii) solar PV, (iv) wind turbines. For the purposes of this presentation the consumption for the Atrium Lights was taken in isolation, as such no high usage discounts are accounted for.
Total cost of energy to supply the load over a typical working week (7th - 14th Oct 2011) • Unfortunately it was very difficult to obtain per kW/h costs from energy providers, however figures from SEAI 2010 and ESB 2009 are used here. • It was decided that the solutions provided would need to be able to accommodate the peak usage in the atrium lights. • The Atrium Lights fall within band IB (20,000kW/h < Yearly Consumption < 500,000kW/h) Atrium Light Statistics: • Average kW = 5.14 kW • Peak Usage = 18.91 kW • Energy Consumption from 7th - 14th Oct 2011 = 863.60kW/h • Yearly Energy Consumption = 45345kW/h
(i) Commercial Suppliers Energy Consumption: Total Energy consumption 7th - 14th Oct 2011 = 863.60 kWh SEAI Electricity & Gas Prices in Ireland Dec 2010 Business Electricity Prices in band IB Electricity Supply Board (ESB) - 2009 (Low Voltage Low Load Factor) ESB LV Low Load Factor Tariff = €0.1532 • Average Ireland tariff kWh = €0.1344
(ii) CHP (Combined Heat and Power) Combined Heat and Power is the use of a engine to simultaneously generate both electricity and useful heat. Model: KWE 20G-4AP Fuel: Natural gas or LPG Operation: Mains Parallel Electrical power: 20 KW Thermal Power: 42KW Fuel: 68 KW Efficiency: 91 % SPL: 58 db(A) @ 1mtr • Cost of Natural Gas - BordGais Energy = €0.0375 kWh • To generate enough electricity to power the Atrium Lights it is necessary to have the CHP unit run at full capacity for 6.2h per day. • The CHP unit must use 68kW of fuel to produce 20kW of Electrical Power, however 42 kW of usable Thermal Power is also generated.
(iii) Solar Photovoltaic A Solar PV is a solid state electrical device that converts the energy of light directly into electricity by the photovoltaic effect. Product Code: SP-HJM250M-20KW Dimensions (mm): 1580 x 1062 x 45 Peak energy: 250W Cell type: Mono Crystalline Plastic Weight: 22kg Installed units in array: 80 Array Peak Energy: 20kW Array Area: 134m2 The general rule for Crystalline panels in Ireland is that for each kWp the panel will produce ~900kWh per year. This is a saving of €2800 per year vs ESB. There is also potential to sell electricity back to the grid, however peak Atrium lighting demand is generally during the day when energy production is highest.
(iv) wind turbine C&F Green Energy CF20 Wind Turbine: Rotor Diameter: 12.8m Tower: 20 m Monopole Max Power: 20 kW An. Yield @ 5m/s av: 47,750 kWh Rated Wind Speed: 9.0m/s Min active wind speed: 2.2 m/s Noise @ 5m/s at 60m: 40 dBA Rated RPM: 110 rpm • The average wind speed over Galway is shown as 7-8m/s at a height of 75m above ground level, this wind turbine just 20m above ground level and should have an average wind speed of approximately 5m/s. • At this wind speed the turbine would produce 47,750kWh per annum which could satisfy the yearly energy consumption of the Atrium Lights.
Conclusion • The Atrium Lights account for on average 2.85% of the total building load. • The energy consumption peaks at ~ 6am when the cleaners come in and manually override the system. Energy consumption is highest because at this time it is still dark outside. • CHP is the most cost effective and reliable energy solution it is however still reliant on fossil fuel for generation. • Wind is the most suitable renewable energy resource for >10kw generation. • The sensors located throughout the building are very accurate when compared to calculated values.
Low Energy Lighting Lux Level Control LED Exit Signs & Emergency Lighting Technology used to Increase Energy Efficiency of Lighting
The atrium lighting is probably the best example of the benefits of the lux level control technology in the engineering building. This innovative technology uses the simple idea of altering the brightness of the lights depending on the amount of natural light available at any given time. This results in a far more energy efficient method of lighting the atrium compared to the traditional on/off lighting systems. From our analysis of the daily trends of the power consumption of the atrium lights, we see how the power usage during the daylight hours of the day is greatly reduced. Lux Level Control
Extremely low energy usage (40kWh/Year approx.) This attention to detail in the design of the lighting system results in the high energy efficiency of the building as a whole. Led Exit Signs & Emergency Lighting
There are a number of retrofit led replacements for the fluorescent cfl lights which are used in the atrium and throughout the engineering building. There are numerous advantages to implementing modern led technology over outdated fluorescent cfl’s. Possible Changes/Improvements to Lighting Systems
Trihal Cast Resin Dry Type Transformer2000kVA–21500-10750V/423V – Dyn11 By standard HD 464 S1
Vector Group Dyn11 • HV windings are Delta connected, represented with a D. • LV windings are represented with a y for star • n shows the neutral was brought out of the star. • Digit 11 shows it leads by 30 degrees.
Climate, Environmental and Fire Behaviour • Climate class C2- operation, transport and storage at ambient temperatures down to -25°C; installation outside. • Environmental class E2- frequent condensation and high pollution or combination of the two. • Fire behaviour class F1- risk of fire limited flammability is acceptable. Self extinguishing of the fire must occur within 60 minutes.
Transformer Equivalent Circuit High Side Vp=11,000V Ip=104.973A Rp=31.75Ω Xp=0.14 Ω Rc=90750 Ω Xc=9474.2 Ω Low Side Vs=244V, Vs(ll)=423V Is=13.323A Rs=31.75 Ω Xs=0.14 Ω Np:NS 11000:423 26:1