Measuring Economic Performance
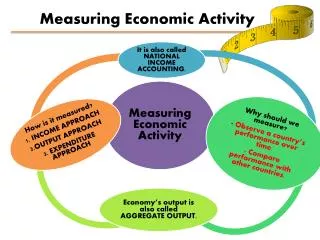
Measuring Economic Performance. Unit 6 Notes. Unit 6, Lesson 1 Notes. National Income and Product Accounts. Economists monitor economic data of the country using national income accounting – collects statistics on production, income, investments, and savings

Measuring Economic Performance
E N D
Presentation Transcript
Measuring Economic Performance Unit 6 Notes
Unit 6, Lesson 1 Notes
National Income and Product Accounts • Economists monitor economic data of the country using national income accounting – collects statistics on production, income, investments, and savings • This data is collected and presented to the government and maintained by the Department of Commerce
Gross Domestic Product • The MOST IMPORTANT measure that is collected is GDP– the dollar value of all final goods and services produced within a country’s borders in a given year • The definition itself is worded that each piece must be looked at individually
Gross Domestic Product • Dollar value is the total selling prices of all goods and services produced in a country in a given year • Final goods and services are the products sold to consumers in a given year • Produced within a country’s borders means that anything produced in the U. S. is counted (Kia plant in Ohio)
GDP does NOT include: • Intermediate goods – products/services used to make final products. • Ex: Car tires (intermediate good) aren’t counted if they are going onto a brand new car (final good). • Avoids multiple counting • Nonproduction Transactions • Transfer Payments (public or private) – money is given for no service/product. Ex: $ as a gift, welfare, social security. • Stocks & Bonds transactions • Sale of USED goods • Non-market TransactionsEx: Time & effort you spend fixing up your car. • Underground Economy – no record exists of the transaction.Ex: babysitting, lawn mowing, maid services, drug trade
Gross Domestic Product GDP Basics: • Always expressed in terms of $. • Primary measure of economy’s performance. • Calculated using either the expenditure approach or the income approach. • Increases in GDP are desirable • When the government looks at GDP, the measurement must be as accurate as possible
Expenditure Approach • To calculate GDP, one way is the Expenditure approach • Economists estimate the annual expenditures ($ spent) on four categories: • Consumer • Business • Government • Net imports/exports • This total equals GDP – practical approach
Income Approach • Another way to measure GDP is the income approach – provides better accuracy • This approach adds up all the incomes in the economy (ex. Income from selling a house for $115,000)
What count’s for GDP? • Warm up on worksheet…
Ana Maria began a greeting card company in 2007. She produces greeting cards for businesses. The year she started, she purchased all the necessary art supplies and special papers used in producing her cards. The supplies and papers were all made in the United States in 2007. She bought used desks and chairs that were made in Tennessee in 2007 and new bookcases that were made in Canada. She also paid a local advertising company $10,000 to create ads and promote her company in business magazines. At the end of the year, she had $420 worth of cards still in inventory. Which items would be counted in determining U.S. GDP for 2007? Explain your answer. • The Greeting Cards Ana sells in 2007? - The desk and chairs? - The bookcases? - The advertising Ana purchases? - Her remaining inventory of cards?
Unit 6, Lesson 2 Notes
Real vs. Nominal GDP • Nominal GDP is GDP measured in current prices - GDP unadjusted for inflation or deflation of prices. • Uses current year’s prices • Real GDP is GDP expressed in constant, or unchanging, prices - GDP that has been adjusted for inflation/deflation. • Reflects price changes so that you may compare if production increased or if higher prices simply caused a higher nominal GDP. (Remember: GDP measures the goods/service produced in one year.)
Other Income and Output Measures • Even though GDP is the primary economic measure, others are also taken • GDP is used to determine other economic measures including: • GNP • Depreciation
Gross National Product (GNP) • GNP is the annual income earned by U. S.-owned firms and U. S. citizens • It is calculated by: GDP + income earned outside the U. S. – income earned by foreign firms and citizens inside the U. S. = GNP • GNP does not account for depreciation – the loss of the value of capital equipment that results from normal wear and tear • So, GNP – Depreciation = Net National Product (NNP) • NNP is the output made after the adjustment for depreciation
Gross national Product • NNP does not account for another factor that reflects the cost of doing business – taxes • So NNP – taxes (sales and exercise) = National Income (NI) • We can then figure out how much individuals make that they can then spend, called Personal Income (PI) • So PI = Other household income + Money business pays out (SS, Income taxes, etc.) – National Income • Then, we look at how much a person actually has to spend after taxes, called Disposable Personal Income (DPI) = Personal income – taxes • Personal Taxes include income, property, estate, etc.
Unit 6, Lesson 3 Notes
Business Cycle • A business cycle is a period of economic expansion followed by a period of economic contraction • These are not minor ups and downs – they are major changes to GDP • There are typically 4 phases of a business cycle: • Expansion • Peak • Contraction • Trough
Expansion • Expansion is a period of economic growth measured by a rise of in real GDP • In this phase the economy as a whole enjoys plentiful jobs and a falling unemployment rate • Economic growth is a steady, long-term increase in GDP
Peak • Peak occurs when GDP stops rising – it has reached the pinnacle of economic expansion
Contraction • Contraction occurs after a peak, when the economy enters a period of economic decline marked by falling GDP • Other conditions may like unemployment and price may vary • Economists have different terms to describe the severity of a contraction: • Recession – exists if real GDP falls for 2 consecutive quarters (6 months) – unemployment normally 6 to 10 months • Depression – exists if a recession is esp. long and severe – high unemployment and low output • Stagflation – exists if real GDP declines (output) and prices rise (inflation)
Trough • When the economy has “bottomed-out” it has reached the trough. • This is the lowest point of economic contraction • GDP stops falling
Factors that Affect the business cycle • Business investment: When the economy is good, businesses invest in new capital. When economy isn’t so good, businesses stop investing and this creates a drop in the output of other sectors of the economy – can also begin firing workers • Interest rates and credit: When interest rates are low, consumers and business are inclined to make purchases. When interest rates are high, they are less likely to spend money, lowering GDP
Factors that Affect the business cycle • Consumer Expectations: When expectations are that we are in a “good” economy, they expect higher wages and available jobs – increase in spending. When expectations are poor, consumers don’t spend money because they expect lay-off and lower incomes – can start a contraction • External Shocks: Negative shocks (drought, hurricane, oil supply) can cause increase in prices and a decline in GDP. Positive shocks (good growing season, finding of new oil supply) can increase GDP and decrease prices
Unit 6, Lesson 4 Notes
Economic Growth • The basic measure of a nation’s economic growth rate is the percentage of change of GDP over a given period time • GDP must also keep up with population growth in order for it to keep being positive • Taking into account population, most economist prefer to rely on real GDP per capita into account • This is the GDP per person in the country
Economic Growth • Real GDP per capita is considered the best measure of a nation’s standard of living • If GDP rises faster than population, the standard of living will go up
Economic Challenges - unemployment • Economists can measure the strength of the economy at any given time by counting the number of unemployed people • There are 4 kinds of unemployment: • Frictional • Seasonal • Structural • Cyclical
Frictional Unemployment • Unemployment always exists, even in a good economy • Frictional unemployment occurs when people take time to find a job • For example: changing jobs, time to find job after finishing school, etc. • In an economy as large as the U. S., economists expect to find a large number of unemployed falling into this category
Seasonal Unemployment • Seasonal unemployment occurs when industries slow or shut down for a season or make a seasonal shift in production schedules • For example, summer jobs, harvests, etc. • Economists expect to see people in this category as well
Structural unemployment • When the type of economy shifts from one sector to another, the skills workers need to have a job also changes • Workers who lack the necessary skills will lose their jobs – this is structural unemployment • There are 5 causes of structural unemployment: • New technology • New resources • Changes in consumer demand • Globalization • Lack of education
Cyclical Unemployment • Unemployment that rises when the economy is down and falls when the economy is good is called cyclical unemployment • For example – Great Depression (1 out of 4 unemployed) and today’s recession (10% unemployment)
Unit 6, Lesson 5 Notes
Measuring unemployment • The amount of unemployment in the nation is an important clue to the nation’s health • Each month, the Bureau of Labor and Statistics polls a portion of the population that tracks unemployment • They compute the unemployment rate: percentage of nation’s labor force that is unemployed • The unemployment rate is a national average and doesn’t take into account regional or local differences
Full employment • 0% unemployment rate is not possible in a market economy – 4-6% is normal • Full employment can occur if there is no cyclical unemployment
Inflation • Inflation is a sustained increase in the average price level of a country • The rate of inflation is measured by the annual percentage change in the level of prices as measured by the consumer price index (measures changes in the cost of living of a typical household) • A sustained fall in the general price level is called deflation – rate of inflation is negative
Inflation • CPI – Consumer Price Index is the quantity of goods and services that a given amount of money will buy for a typical household • With inflation, purchasing power will decrease • With inflation, prices rise faster than income, reducing the standard of living • Real income and buying power will decrease for an individual
Causes of Inflation • Quantity Theory – Too much money in the economy • Demand-Pull Theory – Inflation occurs when demand for goods and services exceeds existing supplies – prices go up • Cost-Push Theory – Inflation occurs because producers increase prices in order to meet increasing costs • This can lead to the spiral effect – cycle that keeps repeating