Measuring Economic Performance
Measuring Economic Performance. Readings. Lequiller François and Derek Blades, 2006, Under standing NATIONAL ACCOUNTS, Organization for Economic Cooperation and Development, Chapter 1 and 2. Link Bureau of Economic Analysis “Introduction to the National Income and Product Accounts” Link.

Measuring Economic Performance
E N D
Presentation Transcript
Readings • Lequiller François and Derek Blades, 2006, Under standing NATIONAL ACCOUNTS, Organization for Economic Cooperation and Development, Chapter 1 and 2. Link • Bureau of Economic Analysis “Introduction to the National Income and Product Accounts” Link
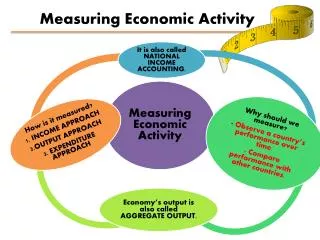
Measuring the Economy • National accounts are the core statistical measure of the economy. • Accounts cover many features of the economy but organizing concept is Gross Domestic Product (GDP)
All goods sold in an economy share a common unit of measure: the price at which they are sold. Gross Domestic Product (GDP) Sum up the value of goods • “GDP combines in a single figure, and with no double counting, all the output (or production) carried out by all the firms, non-profit institutions, government bodies and households in a given country during a given period, regardless of the type of goods and services produced, provided that the production takes place within the country’s economic territory.” L & B p. 15
GDP is a measure of production • Value added at production establishment i • GDP is the sum of VA across establishments.
Economic Concept • Value Added is production at firm level due to the combination of capital equipment and workers. • Value added is not equal to profits because the costs of worker and capital are not deducted.
Link • Accounts are created by national statistical agencies • UN System of National Accounts is the “internationally agreed standard set of recommendations” used by most countries. • Annual data for many countries available at the UN Link
Production ApproachSub-aggregates • Divide production establishments into sectors usually along the line of • Agriculture: Natural Resources (Agriculture, Forestry, Fishing) • Industry: Goods production (Mining, Manufacturing, Utilities, Construction) • Services: Trade, Transport, Communication, Services
Hong Kong: Value Added by Sector UN Main Aggregates Link
Demand • If we add up the value added at all stages of production we derive the value to the end user. • Sum of Final Demand Aggregates equals Sum of Value Added
Expenditure Approach • Purchase of Final goods by end users are divided into two categories: • Consumption: Household expenditure (durables, nondurables & services); government (nondurables & services) expenditure; nonprofit expenditures • Investment: Inventories, Fixed Investment (equipment, structures)
Some Asian Expenditure Shares: 2010 People’s Republic of China Source: United Nations Main Aggregates Database Source: United Nations Main Aggregates Database
Reconciliation • Some demand for domestically produced value added comes from abroad, some domestic demand is satisfied by overseas goods. GDP = Consumption + Investment + Exports – Imports Exports – Imports = External Balance = Trade Balance = Net Exports <> 0
HK Exports & Imports UN Main Aggregates Link
Value Added and Income • Production establishments are where income is generated. Funds raised can be paid for labor and finance costs, left over money is profit income. • Sum of domestic value added (GDP) is equal to wage payments plus financial and profit income referred to as “operating surplus and mixed income.”
Income Approach to Measuring GDP 17 Value Added distributed as income to Employees, Owner/Creditors, & Gov’t Compensation of employees (Wages, Benefits) Net operating surplus (Profits, Net Interest, Rental Income) Taxes on Production
Measuring stick of value is prices of goods in terms of money, but arbitrary changes in the stock of money arbitrarily change prices/the measure of value over time. • Comparing value across time requires abstracting from those arbitrary changes in value.
What is Economic Growth in a world of many goods? • We need to combine the many goods produced or consumed in an economy into one measure. + + + + =?
Value vs. Volume • Consider the sales of a hypothetical single good k (for example, k = apples). • Dollar Value of sales (called vk) is the product of the volume of goods sold (called qk) measured in the goods natural units (i.e. bushels of apples) and the dollar price per good (called pk) vk = pk*qk • Growth of value can be decomposed into growth of volume and growth in prices.
Share of Value • We could measure total value for the economy. • Divide our economy into K categories of goods indexed by k = 1,…, K. • Value of sales of good k, vk. GDP is represented as the sum of value across goods
Value weignts and Inflation Vectors • The weight of k in the economy could be defined as which add up to 1 across sectors. • For every type of good at time t, an inflation vector representing the growth rate of prices.
Real GDP Growth • Growth of value can be decomposed into growth of volume and growth in prices. • Instead we could construct a weighted average
Notes on Price Indices: New Goods • Weights change as production structure of the economy changes • Market baskets used to construct don’t need to stay the same over long-periods. • K categories of goods don’t need to stay the same over long periods. • New goods can be introduced as long as matched goods are compared in every t and t-1 period.
Inflation • We also decompose the growth of the aggregates into growth in prices (inflation) and growth in volume (output).
Midterm Exam • Thursday, October 24th, 2013 • When: 1:30-2:50 p.m. • Where: TBA • Bring writing materials and calculator. • Coverage: Globalization-Human Development • Semi-open book: Bring 1 A4 size piece of paper with handwritten notes on both sides.
Comparing GDP across Countries We want to compare output in two countries though those are measured in different currencies.
Exchange Rates • Exchange Rate: S - # of domestic currency units purchased for 1 US$. • An increase in S is a depreciation of domestic currency and a decrease in S is an appreciation.
Atlas Conversion Method • Exchange rates are volatile, so convert to US dollars using SATLAS= 3 year average.
Major project to compare prices internationally implemented by the World Bank with the help of UN and national statistical agencies. • ICP has been implemented by UN Statistical Office since 1968. Link
PPP’s • Divide expenditures into k = 1,..,K categories of goods. • All j = 1,..J countries (in 2005, J = 146) report total expenditure in domestic currency of all categories . • Sample prices of representative goods from each category in each country. • Construct average of those prices (relative to “anchor” economy) for each country j basic heading type of good k .
WDI provides PPP data for many countries using US$ as anchor currency Hong Kong PPP per Category
PPP Conversion Factor • PPP is a value weighted average of relative prices of all K goods.
PPP 2010 One benchmark for thinking about whether a currency is undervalued or overvalued. If PPP < XR, then domestic goods are relatively cheap, currency is undervalued.
GDP in Intl$ • PPP’s are used to construct comparable measures of GDP for multiple countries by converting them into international dollars. Per capita GDP in international dollars is headline way of comparing living standards.
Use real GDP growth rates to construct path of constant price International $GDP for comparisons of production levels across time and space.
Developing countries tend to be relatively cheap with PPP’s being lower than exchange rates. • OECD countries tend to have more similar price structures, though they tend to be relatively more expensive. • High income, non-OECD countries tend to be relatively cheap. • Compare values measured in different currencies using the PPP and exchange rate method.
Is China the Biggest Economy in the World? • Discuss Subramanian Link
Exchange Rate Method • Exchange Rate Method can be a useful measure if you are going to convert income in one area and spend it in another. • Ex. Your Swiss food company projects that it can at most get a 20% share of the market for Mexican processed foodstuffs. Converting the size of Mexico’s processed food expenditures from Pesos to Swiss Francs is useful info for estimating profits. . • But macro aggregates are often used to give an idea of living standards, here exchange rates are not as useful because they are highly variable and not so representative..
PPP vs. Exchange Rate Conversion • Exchange rates are easily available so exchange rate is a “quick and dirty” comparison. • Measures how many US dollars someone could buy with average income. • However, money goes farther in some countries as many types of goods are relatively cheap (especially in developing countries). • PPP conversion measures how much the goods purchased by the average person would cost in the US. Better measure of living standards.