Download
1 / 25
250 likes | 376 Vues
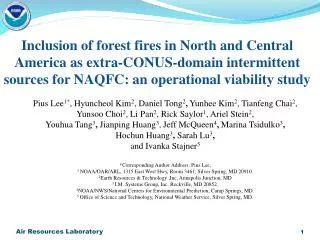
Inclusion of forest fires in North and Central America as extra-CONUS-domain intermittent sources for NAQFC: an operational viability study. Pius Lee 1* , Hyuncheol Kim 2 , Daniel Tong 2 , Yunhee Kim 2 , Tianfeng Chai 2 , Yunsoo Choi 2 , Li Pan 2 , Rick Saylor 1 , Ariel Stein 2 ,

E N D
Inclusion of forest fires in North and Central America as extra-CONUS-domain intermittent sources for NAQFC: an operational viability study • Pius Lee1*, Hyuncheol Kim2, Daniel Tong2, Yunhee Kim2, Tianfeng Chai2, Yunsoo Choi2, Li Pan2, Rick Saylor1, Ariel Stein2, • Youhua Tang3, Jianping Huang3, Jeff McQueen4, Marina Tsidulko3, • Hochun Huang3, Sarah Lu3, • and Ivanka Stajner5 • *Corresponding Author Address: Pius Lee, • 1 NOAA/OAR/ARL, 1315 East West Hwy, Room 3461, Silver Spring, MD 20910. • 2Earth Resources & Technology ,Inc, Annapolis Junction, MD • 3 I.M. Systems Group, Inc. Rockville, MD 20852. • 4NOAA/NWS/National Centers for Environmental Prediction, Camp Springs, MD. • 5 Office of Science and Technology, National Weather Service, Silver Spring, MD.
Issues and focuses of study of DWH • Deep Water Horizon offshore oil platform accident: • April 20, 2010 for 87 days • ~1 mile below sea level, ~ 40 miles off Louisiana coast • (near the coast of Chandeleur Sounds) • burning of skimmed oil, flaring of the fuels directly from well pipe, • and evaporative emissions from oil slick • Share air quality modeling effort • Entire oil spill event to study impact on regional air quality over SE US • Study distribution and fate of oil spill related air pollutants • subject to uncertainties in emission inputs
Estimating evaporative emissions from oil slick NOAA NOS OR&R (National Ocean Service / Office of Response and Restoration) oil slick trajectory model results, initialized with satellite data May 17, 20C10 Near Shore map Off Shore map Near shore Off shore SHAPE files available Courtesy Nesdis/NOAA Sheen in imagery may corresponds to tar balls
Daily Change of DWH oil slick size estimated from the oil slick map Equivalent area of half circle radius (April 22- June 30, 2010) slick areas Light Medium Heavy Approach: • Estimated fresh oil amount in the slicks for different slick types • Approximate evaporation ratios: 90: 9: 1 • Distributed 25% of 4.9M bbl over daily heavy, medium, light
Oil burn locations used for air quality modeling Burn Counts at each 12x12 km cell Burn volume (barrels) • Numbers are gridded into the NAQFC 12km CONUS domain
Minimal impact on surface concentration and surface fluxes between June 1 – July 8, 2010. June 21, 2011 Experimental NAQFC inclines toward high bias for [O3] in warm/humid SE, DWH impact minimal. Experimental NAQFC inclines toward low bias for [pm2.5] in summer
June 21 2011 June 2 2011 June 30 2011 June 12 2011
Intra- and Exo-domain wild fire intermittent source is rather frequent June 21 2011 June 2 2011 June 30 2011 June 12 2011 *Wednesday Talk: Fernando Garcia-Menendez
Emission should include Exo- and intra-domain wild fires ~21x ~12x Agricultural burning prevails in the months of March and April in Mexico 5x HMS wildfire detections during Apr. 2010
Several operationally feasible approaches to include Exo-domain Wild Fires &Poster: Youhua Tang $ Tuesday talk: Fernando Garcia-Menedez *Poster: Hyuncheol Kim et el. “Evaluation of fire modeling systems: fire smoke extension and chemical composition”
GBBEP QFED Total Carbon Emissions for GBBEP & QFED (JUL-SEP 2010) QFED and GBBEP produced similar spatial patterns and monthly variation in total carbon (black + organic carbons) emissions. During the simulated period, both the South America and the Africa had frequent fire activities. In general, QFED has smaller area of detected fires but with stronger carbon emissions while GBBEP has larger area of detected fires with weaker carbon emissions. There is a limited spatial coverage for geostationary satellites at high latitudes. Thus, QFED detected more fires in the Russia, the Siberia, and the Canadian Boreal forest. Hourly flux at 1ox1o
NCEP operation slot ~21x 5x NC and GA fires impacted Discover-AQ area. Analysis day 20110720 http://airquality.weather.gov/ http://ready.arl.noaa.gov Poster: Chris Misenis; $Tuesday Talk: Karsten Baumann
W E S N W E N S Southern Eastern Northern Western
~12x Sample of hourly output from premaq w.r.t parent domain – can be much coarser in temporal and spatial resolution 5x Lowest mid-layer Temperature ~12x Dynamic LBC fed by GOCART or HYSPLIT 5x 10 m Windspeed
Intra-domain wild fire emissions Time series of monthly mean event-count HMS/smoke fraction inside CONUS domain. Blue lines indicates bottom half of domain, and red color indicates upper half of the CONUS domain Hms/Bluesky/Smoke monthly mean fraction owing to Wild fires in Southern Half or Northern half 0.0 0.1 0.2 0.3 0.4 0.5 2006 2007 2008 2009 2010 2011
Flight track: July 20, 2011 Spirals over Wilmington and Edgewood A long hot And muggy Working day Flight track: July 20, 2011
NASA P-3B Flight Pathes July 1-29, 2011http://www-air.larc.nasa.gov/missions/discover-aq/images/DISCOVER-AQ_2011_ALL_P3B_July1-July29.png
15Z NAM predicted 10m wind On July 20, 2011 heat index of 116 oF in D.C. RTMA Less spurious 18Z RTMA NAM predicted 10m wind Max Temp NAM precip Rain gauge analysis 18Z NAM predicted 2m temp RTMA Sharp convergence zone
Comparison of Wind along flight track of P3B on July 20 2011 Less turbulence may not matter as PBL well-mixed, shallow-convection may matter. More frequent low Bias in higher altitudes Spirals over Wilmington and Edgewood Model under-predicted wind shear
Comparison of Wind along flight track of P3B on July 20 2011 CMAQ471 vs obs. [NO2] on July 20, 2011 CMAQ471 vs obs. [NOy] on July 20, 2011 Models high-bias, lack of venting due to fair weather cumulus may exacerbate high-bias
Comparison of Wind along flight track of P3B on July 20 2011 NO2 and TOL both are indicators of vehicular exhaust tracks well; ground-hugging
Comparison of Wind along flight track of P3B on July 20 2011 CMAQ471 vs obs. [NO2] on July 20, 2011 Formaldehyde as proxy of VOC emission CMAQ471 vs obs. [NOy] on July 20, 2011
Spatial distribution of hourly avg. column-integrated AOD Satellite data was also attempted CMAQ471 no_hms_fire AOD MODIS AOD
Summary • Last year’s study on DWH affirms that intra- and extra-domain • wild fire emissions are dominant intermittent sources essential for • Air Quality (AQ) studies – regional as well as continental • Several model configurations to include extra-domain wild fire emission • through ingesting smoke-plume from these fires in the forecast model’s • time-varying chemical Lateral Boundary Conditions (LBC); i.e. • chemical field fed by: (1) GFS-GOCARD-smoke; (2) HYSPLIT-smoke; • and (3) Either use (1) or (2) but through the in-nesting of a large parent • CMAQ domain more than 2 times the geographical area as continental • U.S. • These model configurations are at various degree of development. • They all have pros and cons in terms of operational feasibility for • real time AQ forecasting. • Rich data set obtained from the Discover-AQ campaigns and satellite-based • AOD retrievals are extremely variable in evaluating the • approaches considered.