Download
1 / 41
420 likes | 593 Vues
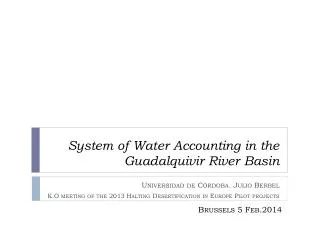
System of Water Accounting in the Guadalquivir River Basin. Universidad de Córdoba. Julio Berbel K.O meeting of the 2013 Halting Desertification in Europe Pilot projects. Brussels 5 Feb.2014. Systems of water accounting in the Guadalquivir River Basin. SIWAG No. 2013/13 Partners:

E N D
System of Water Accounting in the Guadalquivir River Basin Universidad de Córdoba. Julio Berbel K.O meeting of the 2013 Halting Desertification in Europe Pilot projects Brussels 5 Feb.2014
Systems of water accounting in the Guadalquivir River Basin • SIWAG No. 2013/13 • Partners: • Universidad de Córdoba • EVREN (Evaluacion de recursosnaturales) • Period: 12 months 1/feb/2014 to 30/jan/2015 • K.O internalmeeting: • 27/01/2014 • UCO/EVREN/ Confederación Hª Guadalquivir (Sevilla) • Agreement • To cooperate throught the project • Tointegrateresults in Hydrological Plan (revisionduefor 2015)
Thebasin The basin has a Mediterranean climate with a heterogeneous precipitation distribution. The annual average temperature is 16.8C,
Guadalquivir riverbasin • The Guadalquivir River is the longest river in southern Spain (around 650 km) • Population of 4,107,598 inhabitants • Main cities are: Seville, Cordoba, Granada • Covers an area of 57,527 km2 • Main land uses are: • Forestry: 49.1% • agriculture : 47.2% • urban areas: 1.9% • Wetlands: 1.8% • Irrigation 850.00 ha • (25% land, 70% value)
Rain in a Mediterraneanriver (Guadalquivir) 573mm 5 Annual precipitation averages at 573 mm (range between 260 mm and 983 mm ) * 13 en sequia
Dryyears Guadalquivir 1942-2012, yearsbelow 15% of average • Libro Blanco del Agua, mostseveredrought in 200 years are: • Oct.1941 a sept.1945, • Oct.1979 a sept.1983 • Oct.1990 a sept.1995 • In XXI centuryfromOct 2005 tosept 2008. 79-83 90-95 04-09 Drought (>3 years) Desde 1977 10 años (29%) precedidos por uno o mas años secos
Guadalquivir riverbasin figures • Average renewable resources • 7,043 (arithmetic mean) and 5,078 GL/year (median), • Minimum 372 GL/year, Maximum of 15,180 GL/year • 65 dams storage capacity 8,500 GL
Origin of water Source: CHG f(2010)
Unregulatedriver Averagewaterservedis 67%of waterrights
Guadalquivir maineconomic data (*) Basedon INE, preliminar data. Do notquote DifficultconversionfromAdministrativeeconomic data toRiverbasin, weshouldsolvethisissue.
Industrial sectors 24% 28% 23% (*) Basedon INE, preliminar data. Do notquote
Energyconsumptive use of water 2% total 1% total
Irrigation as solution • Irrigation to increase production and profit • New crops are available • Higher yields of crops irrigated versus rain fed • Irrigation to reduce risk • More stable production (yields stabilized) • More crops available (risk diversification) • Move water from: • Winter to summer • Wet to dry years • Mountains to valleys • Less to highly productive areas GuadalquvirMonthly rain and ETP (mm)
Supply (reservoirs) and demand (area) Source: Arguelles et al 2012
Reduction in averagedose (m3/ha) Proposed WA analysis -41% 6.091 Grosswater use Abril/Oct. (2011, ownestimation).
Presa Guadalmellato 2,1 cents/m3 1,3 cents/m3 EMACSA Comunidad de Regantes Guadalmellato 52,8 cents/m3 74,8 cents/m3 57,8 cents/m3 1,7 cents/m3 Comunero Usuarios domésticos Industria Organismos Públicos 5,0 cents/m3 26,4 cents/m3 33,0 cents/m3 26,4 cents/m3 Cultivo SANEAMIENTO 1,2 cents/m3 DOMINIO PUBLICO HIDRAULICO TOTAL 1,02 euro/m3 TOTAL 8 cents/m3 Instruments forcostrecovery Canon y TUA Canon CCAA Derrama Waterprice Canon CCAA Canon vertidos
Expenditurefor water services Million euro (illustration, do notquote)
Price increase Source, INE, data in constantprice 2010 reference
Reduction in urban use Source: (1) Sevilla-Emasesa, Salgueiro, R, ; Andalucía,Spain, INE
Costincrease, reduction in dosis Surface water Groundwater
Impact of irrigationmodernization Berbel et al (unpublished) Analysis of studies on the rebound effect of water saving measures
Use of WAforcostrecoveryanalysis These figures can be compiled from the hybrid supply and use tables.
Final points • A goodopportunitytostudy • Impact of agriculturemodernization (watersaving, costincrease) • Impact of deficitirrigation • Largemediterraneanbasin • Goodavailable data (althought in differentformat) • Possibleintegration of WaterAccounts in BasinHydrological Plan 2015 • Open tosuggestions • Thankyoufortheopportunity