Download
1 / 1
10 likes | 172 Vues
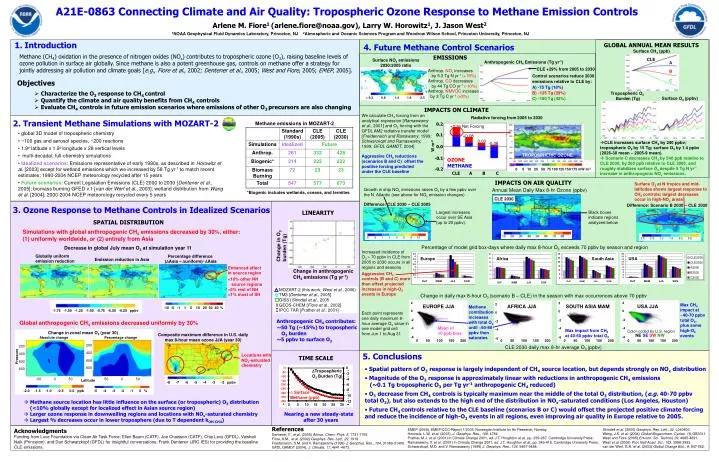
Surface CH 4 (ppb). CLE. Anthropogenic CH 4 Emissions (Tg yr -1 ). A. CLE +29% from 2005 to 2030. B. Control scenarios reduce 2030 emissions relative to CLE by: A) -75 Tg (18%) -125 Tg (29%) -180 Tg (42%). C. < 0.3 0.8 1.4 1.9 2.5. 0.2.

E N D
Surface CH4 (ppb) CLE Anthropogenic CH4 Emissions (Tg yr-1) A CLE +29% from 2005 to 2030 B • Control scenarios reduce 2030 • emissions relative to CLE by: • A)-75 Tg (18%) • -125 Tg (29%) • -180 Tg (42%) C < 0.3 0.8 1.4 1.9 2.5 0.2 +0.16 Net Forcing 0.1 +0.08 0.00 -0.08 W m-2 0.0 TROPOSPHERIC OZONE -0.1 OZONE METHANE -0.2 0 5 10 25 50 75100125150175 mW m-2 Surface O3 at N tropics and mid-latitudes shows largest response to CH4 controls; largest decreases occur in high-NOx areas Growth in ship NOx emissions raises O3 by a few ppbv over the N. Atlantic (see above for NOx emission changes) CLE 2030 Difference: CLE 2030 – CLE 2005 Largest increases occur over SE Asia (up to 20 ppbv). Black boxes indicate regions analyzed below Change in O3 burden (Tg) Decrease in global July mean O3 at simulation year 11 0 Globally uniform emission reduction Percentage difference (DAsia – Duniform)/ DAsia Africa Emission reduction in Asia -2 -4 Enhanced effect in source region Change in anthropogenic CH4 emissions (Tg yr-1) -6 Aggressive CH4 controls (B and C) more than offset projected increases in high-O3 events in Europe -8 <10% other NH source regions <5% rest of NH <1% most of SH -10 -12 2 0 -2 -4 -6 2 0 -2 -4 -6 2 0 -2 -4 -6 2 0 -2 -4 -6 EUROPE JJA AFRICA JJA SOUTH ASIA MAM USA JJA USA Methane contribution increases with total O3 until ~60-80 ppbv then saturates South Asia -10 -5 -1 1 5 10 20 30 40 % -1.75 -1.50 -1.25 -1.00 -0.75 -0.50 -0.25 ppbv Mean of 10 ppb bins Max impact from CH4 at 40-60 ppbv total O3 Color-coded by U.S. region Change in zonal mean O3 (year 30) Composite maximum difference in U.S. daily max 8-hour mean ozone JJA (year 30) NE SE SW NW Absolute change Percentage change 0 50 100 150 200 0 50 100 150 200 0 50 100 150 200 0 50 100 150 200 Europe 200 400 600 800 200 400 600 800 Pressure Locations with NOx-saturated chemistry MOZART-2 (this work; West et al., 2006) TM3 [Dentener et al., 2005] GISS [Shindell et al., 2005 GEOS-CHEM [Fiore et al., 2002] IPCC TAR [Prather et al., 2001] 0 DTropospheric O3 Burden (Tg) -50 -100 -50 0 50 -50 0 50 Latitude -150 X -200 -8 -7 -6 -5 -4 -3 -2 ppbv -250 CLE A B C -5 -4 -3 -2 -1 0 % • Surface Methane (ppb) -300 -2.0 -1.5 -1.0 -0.5 0.0 ppb -350 -400 0 5 10 15 20 25 30 A21E-0863 Connecting Climate and Air Quality: Tropospheric Ozone Response to Methane Emission Controls Arlene M. Fiore1 (arlene.fiore@noaa.gov), Larry W. Horowitz1, J. Jason West2 1NOAA Geophysical Fluid Dynamics Laboratory, Princeton, NJ 2Atmospheric and Oceanic Sciences Program and Woodrow Wilson School, Princeton University, Princeton, NJ 1. Introduction GLOBAL ANNUAL MEAN RESULTS 4. Future Methane Control Scenarios Methane (CH4) oxidation in the presence of nitrogen oxides (NOx) contributes to tropospheric ozone (O3), raising baseline levels of ozone pollution in surface air globally. Since methane is also a potent greenhouse gas, controls on methane offer a strategy for jointly addressing air pollution and climate goals [e.g., Fiore et al., 2002; Dentener et al., 2005; West and Fiore, 2005; EMEP, 2005]. EMISSIONS Surface NOx emissions 2030:2005 ratio Anthrop. NOx increases by 5.3 Tg N yr-1(+19%) Anthrop. CO decreases by 44 Tg CO yr-1(-10%) Anthrop.NMVOCincrease by 3 Tg C yr-1(+3%) Objectives • Characterize the O3 response to CH4 control • Quantify the climate and air quality benefits from CH4 controls • Evaluate CH4 controls in future emission scenarios where emissions of other O3 precursors are also changing Tropospheric O3 Burden (Tg) Surface O3 (ppbv) IMPACTS ON CLIMATE We calculate CH4 forcing from an analytical expression [Ramaswamy et al., 2001] and O3 forcing with the GFDL AM2 radiative transfer model [Freidenreich and Ramswamy, 1999; Schwarzkopf and Ramaswamy, 1999; GFDL GAMDT, 2004] Radiative forcing from2005 to 2030 2. Transient Methane Simulations with MOZART-2 Methane emissions in MOZART-2 • global 3D model of tropospheric chemistry • ~100 gas and aerosol species, ~200 reactions • 1.9o latitude x 1.9o longitude x 28 vertical levels • multi-decadal, full-chemistry simulations • Idealized scenarios: Emissions representative of early 1990s, as described in Horowitz et al. [2003] except for wetland emissions which we increased by 58 Tg yr-1 to match recent estimates; 1990-2004 NCEP meteorology recycled after 15 years • Future scenarios: Current Legislation Emissions (CLE) 2000 to 2030 [Dentener et al., 2005]; biomass burning GFED v.1 [van der Werf et al., 2003]; wetland distribution from Wang et al. [2004]; 2000-2004 NCEP meteorology recycled every 5 years • CLE increases surface CH4 by 240 ppbv; tropospheric O3 by 15 Tg; surface O3 by 1.4 ppbv (2026-30 mean – 2005-9 mean). • Scenario C decreases CH4 by 540 ppb relative to CLE 2030, by 260 ppb relative to CLE 2005, and roughly stabilizes surface O3 despite 5 Tg N yr-1 increase in anthropogenic NOx emissions. Aggressive CH4 reductions (scenarios B and C) offset the positive forcing predicted under the CLE baseline IMPACTS ON AIR QUALITY Annual Mean Daily Max 8-hr Ozone (ppbv) *Biogenic includes wetlands, oceans, and termites Difference: Scenario B 2030 – CLE 2030 3. Ozone Response to Methane Controls in Idealized Scenarios LINEARITY SPATIAL DISTRIBUTION Simulations with global anthropogenic CH4 emissions decreased by 30%, either: (1) uniformly worldwide, or (2) entirely from Asia Percentage of model grid box-days where daily max 8-hour O3 exceeds 70 ppbv by season and region Increased incidence of O3 > 70 ppbv in CLE from 2005 to 2030 occurs in all regions and seasons Change in daily max 8-hour O3 (scenario B – CLE) in the season with max occurrences above 70 ppbv Max CH4 impact at ~40-70 ppbv total O3, plus some high-O3 events Each point represents one daily maximum 8-hour average O3 value in one model grid cell from Jun 1 to Aug 31 Anthropogenic CH4 contributes: ~50 Tg (~15%) to tropospheric O3 burden ~5 ppbv to surface O3 Global anthropogenic CH4 emissions decreased uniformly by 30% CLE 2030 daily max 8-hr average O3 (ppbv) 5. Conclusions TIME SCALE • Spatial pattern of O3 response is largely independent of CH4 source location, but depends strongly on NOx distribution • Magnitude of the O3 response is approximately linear with reductions in anthropogenic CH4 emissions • (~0.1 Tg tropospheric O3 per Tg yr-1 anthropogenic CH4 reduced) • O3 decrease from CH4 controls is typically maximum near the middle of the total O3 distribution, (e.g. 40-70 ppbv total O3), but also extends to the high end of the distribution in NOx-saturated conditions (Los Angeles, Houston) • Future CH4 controls relative to the CLE baseline (scenarios B or C) would offset the projected positive climate forcing and reduce the incidence of high-O3 events in all regions, even improving air quality in Europe relative to 2005. Simulation (1) - Base • Methane source location has little influence on the surface (or tropospheric) O3 distribution (<10% globally except for localized effect in Asian source region) • Larger ozone response in downwelling regions and locations with NOx-saturated chemistry • Largest % decreases occur in lower troposphere (due to T dependent kOH-CH4) Nearing a new steady-state after 30 years References Dentener, F., et al. (2005) Atmos. Chem. Phys. 5, 1731-1755. Fiore, A.M., et al. (2002) Geophys. Res. Lett., 29, 1919. Friedenreich, S.M. and V. Ramaswamy (1999) J. Geophys. Res., 104, 31389-31409. GFDL GAMDT (2004), J. Climate, 17, 4641-4673. Acknowledgments Funding from Luce Foundation via Clean Air Task Force; Ellen Baum (CATF), Joe Chaisson (CATF), Chip Levy (GFDL), Vaishali Naik (Princeton), and Dan Schwarzkopf (GFDL) for insightful conversations; Frank Dentener (JRC-IES) for providing the baseline CLE emissions. EMEP (2005), EMEP/CCC-Report 1/2005, Norwegian Institute for Air Research, Norway. Horowitz, L.W. et al. (2003), J. Geophys. Res., 108, 4784. Prather, M.J. et al. (2001) in Climate Change 2001, ed. J.T. Houghton et al., pp. 239-287, Cambridge University Press. Ramaswamy, V. et al. (2001) in Climate Change 2001, ed. J.T. Houghton et al., pp. 349-416, Cambridge University Press. Schwarzkopf, M.D. and V. Ramaswamy (1999) J. Geophys. Res., 104, 9467-9488. Shindell et al. (2005) Geophys. Res. Lett., 32, L040803. Wang, J.S. et al. (2004) Global Biogeochem. Cycles, 18, GB3011. West and Fiore (2005) Environ. Sci. Technol, 39, 4685-4691. West et al. (2006) Proc Natl Acad. Sci., 103, 3988-3993. van der Werf, G.R. et al. (2003) Global Change Biol., 9, 547-562.