Download
1 / 9
90 likes | 227 Vues
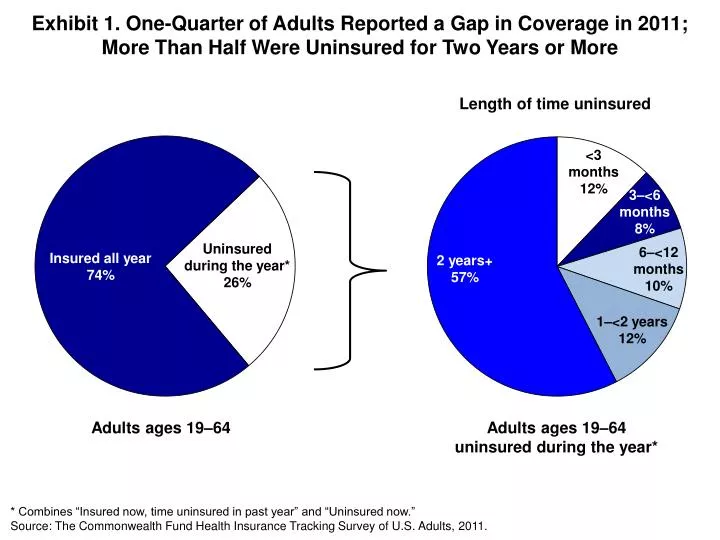
Exhibit 1 . One-Quarter of Adults Reported a Gap in Coverage in 2011; More Than Half Were Uninsured for Two Years or More. Length of time uninsured. <3 months 12%. 3–<6 months 8%. Uninsured during the year* 26%. 6–<12 months 10%. Insured all year 74%. 2 years+ 57%.

E N D
Exhibit 1. One-Quarter of Adults Reported a Gap in Coverage in 2011; More Than Half Were Uninsured for Two Years or More Length of time uninsured <3 months 12% 3–<6 months 8% Uninsured during the year* 26% 6–<12 months 10% Insured all year 74% 2 years+ 57% 1–<2 years 12% Adults ages 19–64 Adults ages 19–64 uninsured during the year* * Combines “Insured now, time uninsured in past year” and “Uninsured now.” Source: The Commonwealth Fund Health Insurance Tracking Survey of U.S. Adults, 2011.
Exhibit 2. Adults in Low- and Moderate-Income Households Are Most Likely to Have Gaps in Health Insurance Percent of adults ages 19–64 Note: FPL refers to federal poverty level. Source: The Commonwealth Fund Health Insurance Tracking Survey of U.S. Adults, 2011.
Exhibit 3. Reasons for Loss of Employer-Sponsored Insurance and Medicaid Main reason lost coverage, adults ages 19–64 uninsured during the year* Employer stopped offering benefits** 9% Could no longer afford it 3% Did not reenroll when required 23% Could no longer afford it 7% No longer eligible because of change in age or income 56% Something else 17% Refused 3% Adults who lost employer-sponsored insurance^ Adults who lost Medicaid^ * Combines “Insured now, time uninsured in past year” and “Uninsured now.” ** Respondent or spouse’s employer. ^ Source of insurance coverage before time uninsured. Source: The Commonwealth Fund Health Insurance Tracking Survey of U.S. Adults, 2011.
Exhibit 4. Most Adults Who Lose Employer or Medicaid Coverage Are Uninsured for Long Periods of Time Percent of adults ages 19–64, uninsured during the year* * Combines “Insured now, time uninsured in past year” and “Uninsured now.” ^ Source of insurance coverage before time uninsured. Source: The Commonwealth Fund Health Insurance Tracking Survey of U.S. Adults, 2011.
Exhibit 5. Most Adults Who Try to Buy Plans in the Individual Insurance Market Find It Difficult to Compare Plans and Find Affordable Coverage Percent of adults ages 19–64 who tried to purchase an insurance plan in the individual market* Found it very difficult or impossible to find coverage they needed Found it very difficult or impossible to find affordable coverage Were turned down, charged a higher price, or had a condition excluded because of a preexisting condition Found it very or somewhat difficult to compare benefits covered Found it very or somewhat difficult to compare premium costs Found it very or somewhat difficult to compare out-of-pocket costs/cost-sharing responsibilities * Base: Adults who tried to buy an individual insurance plan in the past three years. Source: The Commonwealth Fund Health Insurance Tracking Survey of U.S. Adults, 2011.
Exhibit 6. Almost Half of Individuals Who Tried • Did Not End Up Buying a Plan in the Individual Market:Expensive Premiums Most Often Cited as the Reason Reasons did not buy a plan Plan did not cover a preexisting condition 6% Deductibles/co-pays were too high 11% Bought a plan 55% Did not buy a plan 45% Premium was too expensive 62% Gained insurance through another source 7% Other 13% Adults ages 19–64 who tried to buy a plan in the individual market in the past three years Adults ages 19–64 who did not buy a plan • Source: The Commonwealth Fund Health Insurance Tracking Survey of U.S. Adults, 2011.
Exhibit 7. Adults with Gaps in Coverage Are Less Likely to Have a Regular Doctor or Be Up to Date with Blood Pressure and Cholesterol Checks Percent of adults ages 19–64 Insured all year Uninsured for less than one year Uninsured for one year or more Has regular doctor^ Blood pressure checked^^ Cholesterol checked^^ ^ Includes doctor, doctors group, health center, or clinic. ^^ Blood pressure checked in past year; cholesterol checked in past five years (in past year if has hypertension or heart disease). Source: The Commonwealth Fund Health Insurance Tracking Survey of U.S. Adults (2011).
Exhibit 8. Adults with Gaps in Coverage Are Less Likely to Be Up to Date with Recommended Cancer Screenings Percent of adults ages 19–64 Uninsured for one year or more* Insured all year Pap test^ Mammogram^ Colon cancer screening^ * Sample size is too small to show rates for respondents uninsured for less than a year. ^ Pap test in past year for females ages 19–29, past three years ages 30–64; mammogram in past two years for females ages 40–64; and colon cancer screening in past five years for adults ages 50–64. Source: The Commonwealth Fund Health Insurance Tracking Survey of U.S. Adults (2011).
Exhibit 9. Awareness of and Enrollment in Young Adult Coverage Option Under the Affordable Care Act, by Income Percent of adults Aware of dependent coverage provision Stayed on/enrolled in parent’s health plan if ages 19–25, or had any adult child stay on/enroll on their health plan if they have an adult child under age 26 Source: The Commonwealth Fund Health Insurance Tracking Survey of U.S. Adults, 2011.