Chapter 10 – Basic Regression Analysis with Time Series Data
Chapter 10 – Basic Regression Analysis with Time Series Data. What is Time Series Data and why is it Different?. There is a time ordering of the data The past can affect the future, but the future cannot affect the past. Example: National population from 1900 to 2006 (data set NATPOP).

Chapter 10 – Basic Regression Analysis with Time Series Data
E N D
Presentation Transcript
Chapter 10 – Basic Regression Analysis with Time Series Data
What is Time Series Data and why is it Different? There is a time ordering of the data The past can affect the future, but the future cannot affect the past. Example: National population from 1900 to 2006 (data set NATPOP)
What is Time Series Data and why is it Different? Random nature of times series data Formally, the process that generates time series data is called a stochastic or time series process
What is Time Series Data and why is it Different? Random nature of times series data Random sample from a population vs. random sample of time series data
Examples of Time Series Data: Uncorrelated data, constant process model
Famous Time Series Expert –Yogi Berra The future ain’t what it used to be.
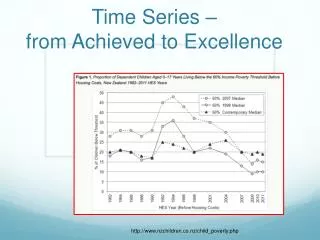
Famous Time Series Expert –Yogi Berra You can observe a lot just by watching. The basic graphical display for time series data is the time series plot which is just a graph of the observations vs. time periods.
Time Series Plot Example Open TRAFFIC2 data set and make time series plot of year vs. statewide total accidents (totacc) In Minitab need to choose series and time stamp
Notice that the histograms look very similar even though the time series behavior is very different Time series plots
When there are two or more variables of interest, scatter plots can be useful
ForecastingIt is difficult to make predictions, especially about the future. – Neils Bohr
Forecasting is useful in many fields: Business and industry Economics Finance Environmental sciences Social sciences Political sciences
Problem definition Data collection Data analysis Model selection and fitting Model validation Model deployment Monitoring forecasting model performance Data Analysis Process:
gfr – number of children born to every 1,000 women of childbearing age from 1913 to 1984. Make a time series plot of gfr Time Series Example – Data Set FERTIL3
pe – average real dollar value of the personal tax exemption from 1913 to 1984. Make a time series plot of pe Time Series Example – Data Set FERTIL3
We want to predict gfr. Lets try this model: Time Series Example – Data Set FERTIL3
We want to predict gfr. Notation for time series model slightly different: Time Series Example – Data Set FERTIL3
The regression equation is gfr = 96.3 - 0.0071 pe Predictor CoefSE CoefT P Constant 96.344 4.305 22.38 0.000 pe -0.00710 0.03592 -0.20 0.844 S = 19.9400 R-Sq = 0.1% R-Sq(adj) = 0.0% Time Series Example – Data Set FERTIL3
residual plots Time Series Example – Data Set FERTIL3
residual plots Time Series Example – Data Set FERTIL3
residual plots Time Series Example – Data Set FERTIL3
residual plots Time Series Example – Data Set FERTIL3
This model suffers from misspecification. Time Series Example – Data Set FERTIL3
Scatter plot of gfr vs. pe Time Series Example – Data Set FERTIL3
What could affect general fertility rate in the U.S.? Many things! • How about these two: • World War II • Availability of the birth control pill Time Series Example – Data Set FERTIL3
ww2 is a dummy variable • 1 if year is 1941 through 1945 • 0 otherwise • pill is a dummy variable • 1 if year is 1963 or greater • 0 otherwise Time Series Example – Data Set FERTIL3
Fit this model with two dummy variables. Time Series Example – Data Set FERTIL3
gfr= 98.7 + 0.0825 pe - 24.2 ww2 - 31.6 pill Predictor CoefSE CoefT P Constant 98.682 3.208 30.76 0.000 pe 0.08254 0.02965 2.78 0.007 ww2 -24.238 7.458 -3.25 0.002 pill -31.594 4.081 -7.74 0.000 S = 14.6851 R-Sq = 47.3% R-Sq(adj) = 45.0% Time Series Example – Data Set FERTIL3
Residual plots: Time Series Example – Data Set FERTIL3
Residual plots: Time Series Example – Data Set FERTIL3
Residual plots: Time Series Example – Data Set FERTIL3
Residual plots: Time Series Example – Data Set FERTIL3
Residual plots: Time Series Example – Data Set FERTIL3
Residual plots: Time Series Example – Data Set FERTIL3
Residual plots: Time Series Example – Data Set FERTIL3
gfr = 98.7 + 0.0825 pe - 24.2 ww2 - 31.6 pill • ww2 is a dummy variable • 1 if year is 1941 through 1945 • 0 otherwise
gfr = 98.7 + 0.0825 pe - 24.2 ww2 - 31.6 pill • pill is a dummy variable • 1 if year is 1963 or greater • 0 otherwise