Download
1 / 24
240 likes | 455 Vues
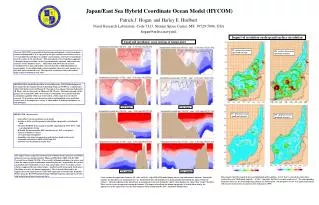
Evaluation of Ocean Components in HWRF-HYCOM Model for Hurricane Prediction. Hyun-Sook Kim and Carlos J. Lozano. Marine Modeling and Analysis Branch, EMC NCEP/NWS/NOAA 5200 Auth Road Camp Springs, MD 20764. Hurricane Verification/Diagnostics Workshop National Hurricane Center Miami, FL

E N D
Evaluation of Ocean Components in HWRF-HYCOM Model for Hurricane Prediction Hyun-Sook Kim and Carlos J. Lozano Marine Modeling and Analysis Branch, EMC NCEP/NWS/NOAA 5200 Auth Road Camp Springs, MD 20764 Hurricane Verification/Diagnostics Workshop National Hurricane Center Miami, FL 4-6 May 2009
Objectives • Evaluate ocean model skill to accurately represent processes of interest. • Evaluate hurricane forecast system to provide accurate air-sea fluxes. • Evaluate the ability of observations and data assimilation to accurately represent initial conditions in regions and for state variables of interest.
Katrina Rita Kyle Gustav TrackForecast Skill Comparison Black – HYCOM Red – Op. • Remarks: • Comparable to Op. • Coherent Forecast Summary: • Mean Difference is at the same order of magnitude; • Variations are consistently smaller
Black – HYCOM Red – Op. Katrina Rita Gustav Kyle IntensityForecast Skill Comparison • Remarks: • Comparable to Op. • Coherent Forecast Summary: • Mean Difference is at the same order of magnitude; • Variations are consistently smaller
3-way Coupling HWRF-HYCOM-WAVEWATCH III Critical Ocean Parameters for Hurricane-Ocean Interaction • Sea Surface Temperature • modulate heat fluxes • contribute to overall hurricane heat engine efficiency • Sea State • modulate flux-exchange coefficients • modulate momentum fluxes • Currents • modulate surface gravity waves and internal waves • redistribute SST
Data Assimilation for HWRF-HYCOM • Improve the estimate of sub-surface ocean structures for IC and nowcast, based on • remotely sensed observations of sea surface height (SSH), sea surface temperature (SST); • in situ temperature (T) and salinity (S); and • model estimates. • Improve the joint assimilation of SSH, SST, T&S.
Data assimilation components (I) • Observations • SST: in situ, remotely sensed (AVHRR, GOES) • SSH: remotely sensed (JASON1, JASON2, ENVISAT) • T&S: ARGO, CTD, XCTD, moorings. • T: AXBT, moorings • Climatology sources • SSH: (global) MDTRio-5 and Maximenko-Niiler • SSHA: Mean and STD from AVISO (global) • SST: Mean and STD from PATHFINDER version 5, Casey NODC/NOAA (global) • T&S: Mean from NCEP (Atlantic) and STD from Levitus • Quality Control Observation accepted if • Anomaly from climatological mean is within xSTD; and • Anomaly from model nowcast is within STD.It assumes there are no model biases.
Data assimilation components (II) • Data Assimilation Algorithm 3DVAR = 2D(modellayers)x1D(vertical) • 2D assumes Gaussian isotropic, inhomogeneous • covariance matrix. • Jim Purser’srecursive filtering. • 1D vertical covariance matrix. • Constructed fromcoarserresolution simulations. • SST extended to model defined mixed layer. • SSHlifting/loweringmain pycnocline (mass conservation). • T&Slifting/loweringbelow the last observed layer.
Close Look at HWRF-HYCOM Hurricane-Ocean interaction Example: HWRF-HYCOM simulations for Rita Under the footprint of a storm, heatflux can be modulated by sea surface temperature (SST). Negative feedback between the SST response and the hurricane intensity (Change and Anthes, 1979)
Oceanic Processes related to SST Cooling in the Near Field • Heat flux across the air-sea interface • Mixing in the upper ocean layer • Upwelling/downwelling • Horizontal advection Processes of multi-spatial and temporal scales ! At the passage of a cyclone, large wind stress results in large SST cooling. The upper ocean structure that matters for this change includes: • SST; • MLD; and • ∂T/∂Z (the strength of stratification) ~ Z26
Position Time Sea Surface Temperature Gustav A Size: 34-kt Average SST cooling rate: For a major Hurricane, e.g. Gustav ~0.3oC/6-hr For a weak storm, e.g. Kyle ~0.1oC/6-hr 6-hour after B 6-hour before
Metrics of Hurricane-Ocean interaction • Choice would be: • a point value; • an areal averaged;or • integrated value over the footprint of a storm. • Does thesizeof the footprint matter?
R<=34-kt R<=50-kt ΔSST ~0.8oC R=150-km ΔSST ~0.4oC ΔSST ~0.7oC Example 1: The Size of the footprint matters!
Latent Heat Flux estimates (W/m2) 34-kt 150-km S M Point 2,104 2,104 Ave. 648 1,056 150-km 34-kt Integr. 2.0x10⁶ 0.7x10⁶ Example 2: Heat and Momentum Flux Estimation
cold wake deepening undulation SST, MLD and Z26 Change at a Given Transect UT ~ 5 to 4 m/s L6hr ~108 to 86 km
Matter for the measure of Hurricane-Ocean Interaction: • Metrics • The size of the footprint • Asymmetric distribution • Definition of Ocean Mixed Layer Depth/Thickness
Observations (real-time) Data assimilation to improve IC – a pipe line set up and improved data assimilation method (real-time data assimilation for 2009 season) (also Model verification) Total 7 Surveys, Including pre- and post-storm samplings. AXBT Observations for Gustav
Model verification – Gustav (pre- and post-storm conditions)
Pre-storm survey (Gustav) Observation Simulation
Matter for the measure of Hurricane-Ocean Interaction: • Metrics • The size of the footprint • Asymmetric distribution • Definition of Ocean Mixed Layer Depth/Thickness Sampling Strategy for AXBT, e.g.
MMAB monitoring of Hurricane Ocean Parameters • Hurricane track and intensity records • In situ/remotely sensed observations: • XBT,moorings, CTD, current meters • SST & Altimeter (analysis) • Model nowcast and forecast fields of • a. Sea Surface Temperature • b. Mixed Layer Depth • c. Z26 http://polar.ncep.noaa.gov/ofs/hurr/NAOMIex/ocean_parameters.shtml User protected URL:
Acknowledgement Eric Ulhorn, Rick Lumpkin, Peter Black, Pearn P. Niiler, Jan Morzel, HWRF/EMC team, HYCOM/EMC team