Download
1 / 36
360 likes | 381 Vues
This study evaluates HWRF model coupled air-sea thermodynamics using observational data from Tropical Cyclone Buoy Database. The evaluation compares HWRF-3.2 model runs with TC Buoy observations, focusing on Hurricane Katia. Results show areas of forecast accuracy and under-prediction in intensity. The study explores the main drivers of variability in near-surface thermodynamic fields and proposes a framework to improve HWRF forecast performance. Potential enhancements and goals for systematic evaluation and improvement of HWRF model are discussed.

E N D
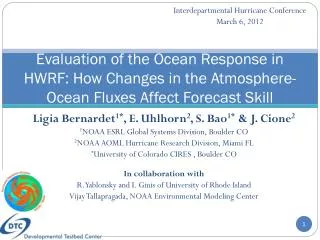
HWRF Evaluation: Phase I- Hurricane Air-Sea Interaction Joseph J. Cione Eric W. Uhlhorn NOAA/AOML/HRD Special thanks to HRD’s HWRF Model Team: Gopal, Thiago Quirino, Xuejin Zhang
An evaluation of HWRF coupled air-sea thermodynamics… • Observations from Tropical Cyclone Buoy Database (TCBD, Cione et al. 2000,2003) • HWRF-3.2 2011 retrospective model runs
TC Buoy Observations • Cione et al. 2000,2003 • Temperature and humidity reported hourly • Winds (10-min mean) reported every 10 mins. • Observations adjusted to 10-m level • Winds converted to 1-min mean
Specific Observational Case StudyHurricane Katia (2011) Katia NDBC 41044 – Katia 4 September time
HWRF-3.2 Retrospective Runs 2011 • Storms • Irene-09L (34 runs) • Katia-11L (46 runs) • Maria-14L (41 runs) • Ophelia-16L (48 runs) • Philippe-17L (60 runs) • Rina-18L (20 runs) • 126 hr simulations, output every 3 hours
HWRF-3.2 Configuration • 3 km inner nest • Coupled to ocean (POM) • Modified Ck, Cd (CBLAST) • Modified eddy diffusion (Zhang 2011) • Operational in 2012 • No sea spray contribution to fluxes
Methodology • Compute T10, q10 from output model fields • Sample model at TCBD buoy locations falling within model grid as cyclones translate/evolve • Compute statistical distributions and compare with observations
2011 HWRF & TCBD Storm Stats TCBD HWRF
Computing T10, q10 • Fields of SST, latent (Hl) and sensible (Hs) heat fluxes, and 10-m winds (U10) are provided as model output Exchange coefficients defined at the 10-m level
Case Study Comparisons • Hurricane Katia • “Good” forecast • “Bad” forecast (intensity under-prediction)
Simulated Buoy Observations: Hurricane Katia“Good” Forecast Example • HWRF forecast initialized at 01 September 12Z (YD 244.5) • Buoy passage at 04 September 12Z (YD 247.5) Center Passage
SST (°C) T10 (°C) q10 (g/kg) RH (%) DT (°C) Dq (g/kg)
Simulated Buoy Observations: Hurricane KatiaUnder-forecast Example • HWRF forecast initialized at 02 September 06Z (YD 245.25) • Buoy passage at 04 September 12Z (YD 247.5) Center Passage
q10 (g/kg) SST (°C) T10 (°C) RH (%) DT (°C) Dq (g/kg)
SST TCBD HWRF
T10 TCBD HWRF
q10 TCBD HWRF
DT TCBD HWRF
Dq TCBD HWRF
What is the main driver of q variability…Ocean or Atmosphere? TCBD HWRF V3.2
Intensification vs. Weakening Wave Number 0 axi-symmetric T/q structure Additional Model/Observation Air-Sea evaluation possibilities… Wave Number 1 asymmetric T/q structure
Summary • A framework for evaluating HWRF near-surface thermodynamic fields has been developed • Relative to TCBD obs., HWRF-3.2 is generally: • Warmer (SST and T10) at all radii inside 250km • More moist (q10) at all radii • Cases studied suggest ambient/initial SST conditions are reasonable but model under-cools in wake • Contrasts previous notion of overcooling (IHC 2009) • Initial sub-surface structure is not well known
Summary (continued) • Variability of model SST, T10 and q10 (and derived fields of T, q) are significantly lower relative to the TCBD • Least 42% (SST); 43% (T10); 48% (T); 53% (q10); Most 70% (q) • In most cases ‘ambient’ model fields (>350km from the TC) compare well with mean obs from the TCBD (SST, T10) • Model q10 is the exception where modestly drier ambient moisture conditions were found when compared to the TCBD (despite relatively more moist conditions simulated inside 350km) • HWRF T was significantly less than TCBD T < 250km • HWRF q similar to TCBD q at most radial distances • Here however, this is a classic example of getting the right answer (Q) for the wrong reason (SST too warm, q10 too moist) • > Leading to other, unintended impacts within the model? • Model (TCBD obs) q driven by ocean (atmosphere) --> ! • Add’l TCBD/HWRF air-sea comparisons/evaluations possible
A proposal to establish a dedicated Hurricane Model Evaluation and Improvement Project
Motivation…. • Overall objective: Improve HWRF forecast performance through a systematic evaluation process, whereby model biases are documented, understood, and ultimately eliminated by implementing accurate observation-based physical parameterizations • Goals: • Assemble comprehensive observational databases (buoy, dropsonde, Doppler radar, microphysics, etc) • Establish a framework for comparing numerical model output with observations (sampling, statistics, etc) • Systematically evaluate numerous physical and dynamical aspects of HWRF coupled model system against historical observational database at HRD • Seek to eliminate model biases by developing observation-based parameterizations of physical processes • Target and eliminate data gaps that impede effective model evaluation
The Good – track forecast improvements Current Capabilities Additional Motivation:Long-term forecast trends…. The Bad - Intensity no real gains No progress with intensity in last 15-20 years • Errors cut in half over past 15 years • 10-year improvement - As accurate at 48 hours as we were at 24 hours in 1999 • 24-48h intensity forecast off by 1 category • Off by 2 categories perhaps 5-10% of time
Goals Improve Forecast Accuracy Hurricane impact areas (track) – 50% in 10 years Severity (intensity) – 50% in 10 years Storm surge impact locations and severity Extend forecast reliability out to 7 days Quantify, bound and reduce forecast uncertainty to enable risk management decisions
Accurately predicting hurricane intensity change…How did we get here and how do we get where we want to go? • Over the past 50 years NOAA has amassed a treasure trove of valuable (and often unique) observations within the hurricane environment. • Working closely with government and academic partners, NOAA’s Hurricane Research Division (and the NHRL in earlier times) has remained at the forefront of an ongoing effort to better understand the hurricane environment through the use of targeted observations. • More recently, advances in computing as well as access to additional resources through HFIP, have allowed NOAA to also make significant (and accelerated) advancements in tropical cyclone numerical modeling. • The next critical step in the prediction improvement process is to effectively merge these two areas of strength by establishing a dedicated, long-standing effort to methodically evaluate and ultimately improve NOAA’s operational hurricane forecast system. How?
A proposal to establish a…Hurricane Model Evaluation and Improvement Project Overall Goal: To improve numerical forecasts of intensity change by strategically and systematically utilizing observations. Proposed path to achieve this goal… Begin a systematic, ‘holistic’ approach to evaluate and improve NOAA’s operational hurricane forecast system by utilizing new and existing observations in order to significantly enhance current operational model physics and parameterization routines. How?
Evaluation and Improvement Methodology… • Compare output from discrete aspects of the operational hurricane modeling system (e.g. air-sea interaction) with similar observationally-based corollaries over appropriate spatial & time scales. • Emphasize analyses highlighting wave number 0/1 (i.e. mean/asymmetry) structure. • Based on results from these inter-comparisons, identify and begin work in specific areas where model improvement may be possible (e.g. model physics enhancement, parameterization modification, etc). • In addition, also identify areas within the hurricane system that cannot currently be effectively evaluated due to inadequate data sampling. • Target these “observational gaps” by strategically utilizing NOAA’s Hurricane Field Program and other data acquisition opportunities (e.g. partner field programs, satellite measurements, new sensor/platform technologies) in order to improve our ability to effectively evaluate, and ultimately improve, model fields going forward. • In parallel, conduct targeted OSE/OSSE experiments to help determine the optimal mix of new and existing observations that are most likely to result in improved future forecasts of hurricane intensity change. • As model improvements are made, conduct process-oriented simulations that investigate key elements of the hurricane forecast system. Such efforts will help improve basic physical understanding and better quantify model sensitivity and overall variability.
Project Stage I: Hurricane Air-Sea Interaction… The hurricane model evaluation and improvement project is envisioned as a multi-stage effort that includes several iterative phases. The first stage that is being proposed is an in-depth model/observational inter-comparison of the hurricane air-sea environment. It is proposed that this particular region of the storm be analyzed first since it is believed that existing air-sea observations can adequately describe the mean and asymmetric state associated with this region of the hurricane (i.e. waves 0/1). As such, properly scaled analyses derived from model output should enable a realistic and reasonably accurate assessment of model performance (relative to observations) as it relates to this critically important region of the storm. How?
Hurricane Air-Sea Interaction Evaluation and Improvement Methodology… • Establish a ‘clear picture’ of air-sea conditions based on 30+ years of direct measurements collected within the inner and outer core hurricane environment over a wide array of storm conditions. • Compare observed fields with comparable/appropriately-scaled model air-sea analyses over a wide array of storm conditions (e.g. hurricane, tropical storm, intensifying, weakening, fast/slow moving, etc). • In addition, model/observational comparisons using various flow-relative frameworks (e.g. earth-relative, storm motion-relative, shear-relative). • Consistent with the project’s objectives, analyses and inter-comparisons would concentrate on model/observational differences associated with mean and asymmetric structure (i.e. wave # 0/1). • Analyses would include assessment of near surface atmospheric and oceanic model performance. • Once specific areas of improvement are targeted, key HRD, AOML, ESRL and EMC personnel would work closely and interactively to improve atmospheric model surface layer, upper ocean physics and associated parameterization routines. • After necessary improvements to the modeling system have been made, conduct targeted idealized modeling studies to ensure documented findings are correct for the right (physical) reason(s). Such studies should also help improve overall physical understanding and better document model variability associated with the air-sea coupled system. • Highlight any “observational gaps” that may exist within the air-sea interactive environment and provide an assessment of how to best target such gaps going forward (e.g. new field experiments, new observing platforms (UAS, UOV), new/improved sensors, etc). • If appropriate, work closely with AOML, ESRL and other collaborative scientists to implement targeted OSE/OSSE experiments designed to determine the optimal mix of new and existing observations most likely to improve future forecasts of hurricane intensity change. • Once/if significant changes have been made to the model, conduct “before and after”simulations that highlight the improvements that were achieved (e.g. improved physical representation of the air-sea environment (mean and asymmetric fields), appropriate variability attained, and (hopefully) a measure of improved forecast accuracy). • As needed, conduct periodic updates to HFIP and other NOAA leadership as progress is made. • Maintain existing funding & explore avenues for additional resources (i.e. new data/funding opportunities as they arise).
After air-sea evaluations and improvements have been made….Project Stage II: Hurricane Boundary Layer Building upon successes and incorporating lessons learned from the air-sea effort already described, expand activities to include model/observation comparisons within the hurricane atmospheric boundary layer environment…
Resource requirements to establish and maintain such a Project… • Establish full-time leadership to oversee, manage and develop the highly-interactive group dynamic. • Secure commitments from AOML, ESRL, HFIP and other institutions in NOAA actively involved in hurricane model development, data collection and assimilation to actively engage and provide interactive support and resources (i.e labor, logistics, travel, etc) for the project as required. • Maintain NOAA’s annual Hurricane Field Program in some form (with our without a manned P-3s contingent). • Maintain ongoing efforts (and the necessary financial support) to adequately investigate, test and acquire new and/or evolving observing technologies that could potentially lead to improved operational forecasts.