CAPILLARY VISCOMETER
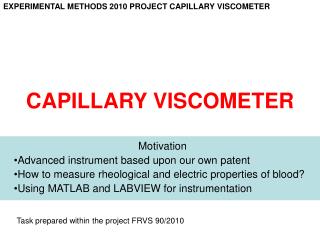
EXPERIMENTAL METHODS 2010 PROJECT CAPILLARY VISCOMETER. CAPILLARY VISCOMETER. Motivation Advanced instrument based upon our own patent How to measure rheological and electric properties of blood? Using MATLAB and LABVIEW for instrumentation. Task prepared within the project FRVS 90/2010.

CAPILLARY VISCOMETER
E N D
Presentation Transcript
EXPERIMENTAL METHODS 2010 PROJECT CAPILLARY VISCOMETER CAPILLARY VISCOMETER Motivation Advanced instrument based upon our own patent How to measure rheological and electric properties of blood? Using MATLAB and LABVIEW for instrumentation Task prepared within the project FRVS 90/2010
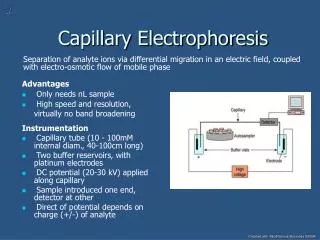
EXPERIMENTAL METHODS 2010 PROJECT CAPILLARY VISCOMETER Aim of project: Measurement of rheological properties (viscosity of liquids) using a capillary viscometer, that is still under development. Computer control and MATLAB software devolopment. 1–glass cylinder, 2-metallic piston, 3-pressure transducer Kulite, 4-tested liquid, 5-plasticholder of needle, 6-needle, 7-calibrated resistor (electric currentneedle-tank), 8-calibrated resistor (current flowing in tank), 9-AC source (3-30V), 10-SS source for pressure transducer (10V), 11-A/D converter, 12-procesor, 13-metallic head, 14-push bar, 15-scale of volume
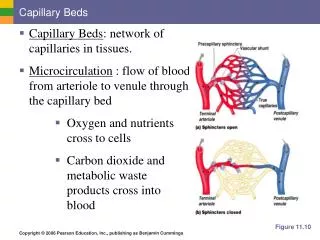
EXPERIMENTAL METHODS 2010 PROJECT CAPILLARY VISCOMETER y uw H x Rheology of liquids / fundamentals Constitutive equation of fluids is relationship between kinematic stimulus (flow, characterized by rate of deformation tensor) and dynamic response (stress tensor). The simplest linear relationship holds for the so called Newtonial fluids (for example water, air, oils, but not more complicated liquids like yoghurt, ketchup, polymer melts) is shear stress (one component of stress tensor) and is shear rate (one component of tensor of rate of deformation). Coefficient of proportionality is dynamic viscosity (units Pa.s) – this value should be evaluated from experiment. The equation (1) holds in this simplified one-dimensional form only for the so called simple shear flows, e.g. flows of a layer of fluid between two parallel plates one of them being fixed and the second one moving with a constant velocity uw, (a similar velocity profile develops also in a narrow gap between a steady outer cylinder and an inner rotating cylinder – this arrangement is typically used in rotational rheometers)
EXPERIMENTAL METHODS 2010 PROJECT CAPILLARY VISCOMETER Simple shear flow in pipe Simple shear flow exists also in laminar flow in a straight circular pipe, where volumetric flowrate [m3/s] axial gradient of pressure pipe of inner radius R (2,3) Therefore by measuring flowrate and pressure drop at a steady laminar flow in a tube (capillary) it is possible to evaluate viscosity as a ratio Actual flowrate should be linear function of pressure gradient as follows from Eqs.(1-3) and this equation is known as the Hagen Poiseuille law (mention the fact that the flowrate increases very rapidly with radius of pipe - 4th power). In this experiment the liquid is expelled by a piston from a syringe through a thin needle manually (therefore it is not possible to arrange a constant flowrate during the whole experimental run). Nevertheless it is not necessary to measure the whole course of flowrate as a function of time. It will be sufficient to record and to integrate the time course of pressure p(t). It follows from the fact that the volume is the time integral of flowrate L is length of needle, R is radius of needle and tstart, tend times of begin and end of the piston displacement.
EXPERIMENTAL METHODS 2010 PROJECT CAPILLARY VISCOMETER Measurement procedure
EXPERIMENTAL METHODS 2010 PROJECT CAPILLARY VISCOMETER LABVIEW Experiment is controlled by National Instruments software and is implemented as VI program STRIKACKA Under preparation Scales of voltages (only for graph, data will be stored always in Volts, without any scaling). File name, where time and 3 corresponding voltages will be recorded, after switching button WRITE.
EXPERIMENTAL METHODS 2010 PROJECT CAPILLARY VISCOMETER MATLAB programming Simplest processing suitable only for Newtonian liquids (electrical resistance is not recorded) t=a(1:end,1); p=a(1:end,2); ndata=length(t); nconst=ndata/20+2; pm=mean(p(1:nconst)) ps=std(p(1:nconst)); plim=pm+5*ps; i=1; while p(i)<plim & i<ndata/2 i=i+1; end nstart=i pme=mean(p(ndata-nconst:ndata)) pse=std(p(ndata-nconst:ndata)); plim=pme+5*pse; i=ndata; while p(i)<plim & i>nstart+5 i=i-1; end nend=i % pbar subtracted atmospheric pressure and recalculated by calibration % constant of Kulite pbar=(p-(pme+pm)/2)/14.303e-8; % integral of pressure dtdata=(t(ndata)-t(1))/(ndata-1); pint=sum(pbar(nstart:nend))*dtdata; % mju=pi.d^4/(128L.V/pint) % Gamma = 4V/(pi.d^3.deltat). mju=3.141*dn^4/(128*ln*vstart/pint) gamma=4*vstart/(3.141*dn^3*(t(nend)-t(nstart)))
EXPERIMENTAL METHODS 2010 PROJECT CAPILLARY VISCOMETER MATLAB programming Advanced processing of non-Newtonian liquids (electrical resistance is used for flowrate measurement) i=1; for ibin=1:nbin tmean=0; pmean=0; u1max=0; u2max=0; for j=1:nb tmean=tmean+t(i); pmean=pmean+pbar(i); u1max=max(u1max,u1(i)); u2max=max(u2max,u2(i)); i=i+1; end tb(ibin)=tmean/nb; pb(ibin)=pmean/nb; u1b(ibin)=u1max; u2b(ibin)=u2max; end % nbstart=floor(nstart/nb); nbend=floor(nend/nb); u1start=mean(u1b(1:nbstart-1)); u2start=mean(u2b(1:nbstart-1)); u1end=mean(u1b(nbend+1:nbin)); u2end=mean(u2b(nbend+1:nbin)); % even now it is possible to cut off initial and ending part tr=tb(nbstart:nbend); pr=pb(nbstart:nbend); u1r=u1b(nbstart:nbend); u2r=u2b(nbstart:nbend); m=length(tr) %filtration of pressure and voltage prf=max(0,sgolayfilt(pr,2,19)); u1rf=sgolayfilt(u1r,2,19); u2rf=sgolayfilt(u2r,2,19); % recalculate voltages to volumes k=vstart*u1start/u2start; vr=k*u2rf./u1rf; % flowrate for i=2:m-1 dvdt(i)=max(0,-(vr(i+1)-vr(i-1))/(2*dt)); end dvdt(1)=-(vr(2)-vr(1))/dt; dvdt(m)=-(vr(m)-vr(m-1))/dt; dvdtf=max(0,sgolayfilt(dvdt,2,19)); % gamv=32*dvdtf/(3.141*dn^3); %recalculated to pascals tauw=dn*prf/(4*ln)*1e5; % mean viscosity mjuv=tauw./gamv; mju=mean(mjuv) plot(gamv,tauw,'ro') % dn-diameter of needle, Ln-length of needle % dp-diameter of piston % rf-fixed resistance % vstart-initial volume % vend-final volume % kp= calibration constant of pressure transducer (=1/14.303e-3) t=a(1:end,1); p=a(1:end,2); u1=a(1:end,3); u2=a(1:end,4); ndata=length(t) nconst=ndata/20+2; pm=mean(p(1:nconst)) ps=std(p(1:nconst)); plim=pm+5*ps; i=1; while p(i)<plim & i<ndata/2 i=i+1; end nstart=i pme=mean(p(ndata-nconst:ndata)) pse=std(p(ndata-nconst:ndata)); plim=pme+5*pse; i=ndata; while p(i)<plim & i>nstart+5 i=i-1; end nend=i % pbar subtracted atmospheric pressure and recalculated by calivration % constant of Kulite pbar=(p-(pme+pm)/2)*kp; %BINING dtdata=(t(ndata)-t(1))/(ndata-1); nb=round(0.03/dtdata) dt=dtdata*nb; nbin=floor(ndata/nb)
EXPERIMENTAL METHODS 2010 PROJECT CAPILLARY VISCOMETER LABORATORY REPORT • Front page: Title, authors, date • Content, list of symbols • Introduction, aims of project, references • Description of experimental setup • Theory and software design (MATLAB program) • Geometry of needles (D,L), processed volumes, used liquids • Experiments: Recorded time courses of pressure (graph) • Results: Viscosities (table) or graph (viscosity-temperature/shear rate) • Conclusion (identify interesting results and problems encountered)
EXPERIMENTAL METHODS 2010 PROJECT CAPILLARY VISCOMETER LABORATORY REPORT
EXPERIMENTAL METHODS 2011 PROJECT CAPILLARY VISCOMETER LABVIEW improved Experiment is controlled by National Instruments software and is implemented as VI program PUTEMP supply voltage to Kulite Voltages: pressure, fixed resistor, syringe Under preparation T-thermocouple Volume of liquid is evaluated from voltages
EXPERIMENTAL METHODS 2011 PROJECT CAPILLARY VISCOMETER LABVIEW improved Experiment is controlled by National Instruments software and is implemented as VI program PUTEMP root mean square of voltage at trimmer (fixed resistor) ratio of voltages Usyringe/Utrimmer is proportional to volume root mean square of voltage at syringe (variable liquid column)
EXPERIMENTAL METHODS 2011 PROJECT CAPILLARY VISCOMETER LABVIEW improved Experiment is controlled by National Instruments software and is implemented as VI program PUTEMP recorded volume (relative) recorded pressure (voltage)
EXPERIMENTAL METHODS 2011 PROJECT CAPILLARY VISCOMETER LABVIEW improved Calibration (repeated experiment with water) recorded volume (relative) by Labview Volume in ml (from scale on syringe)