Download
1 / 31
310 likes | 429 Vues
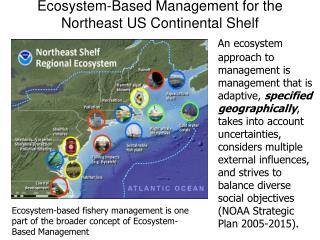
Change in Ocean Surface Thermal Habitat in a Continental Shelf Marine Ecosystem and Its Affect on Lower Trophic Level Organisms Kevin Friedland , Joe Kane, Janet Nye, Jon Hare, John Manderson , Michael Fogarty.

E N D
Change in Ocean Surface Thermal Habitat in a Continental Shelf Marine Ecosystem and Its Affect on Lower Trophic Level Organisms Kevin Friedland, Joe Kane, Janet Nye, Jon Hare, John Manderson, Michael Fogarty
From: “Long-term trends and regime shifts in sea surface temperature on the continental shelf of the northeast United States” Friedland and Hare, 2007
Thermal Habitat Area of the ocean surface within a temperature range
Annual Distribution of Thermal Habitats for the Northeast Shelf
Principal Zooplankton Species Pseudocalanusspp:P. moultoni and P. newmani
Mean Latitudinal Catch Trends for Principal Zooplankton Species Spring Fall
Catch Weighted Latitude of Seasonal Distributions Using data for Feb-April (36-43°N) as indicative of spring and September-November (37-44°N) as fall, calculate the CPUE by latitudinal bins, including zero tows, then calculate the CPUE weighted latitude of the distribution. Difference between the spring and fall meant to represent the annual distributional excursion. Realized Habitats of Seasonal Distributions Using data post-stratified by 1° bins for Feb-April (bins with 28 of 31 years of data and year with at least 27 bins) as indicative of spring and September-November (same except at least 26 bins) as fall, calculate the bin CPUE, if CPUE>0.1 of season mean CPUE, sum the bin area. Seasonal Stratified Area Weighted Catch Per Unit Effort Using data post-stratified by 1° bins for Feb-April (bins with 28 of 31 years of data and year with at least 27 bins) as indicative of spring and September-November (same except at least 26 bins) as fall, calculate the bin size-weighted CPUE, including zero tows, then log transform and take Z-score.
Catch Weighted Latitude of Seasonal Distributions Realized Habitats of Seasonal Distributions Seasonal Stratified Area Weighted Catch Per Unit Effort
Catch Weighted Latitude of Seasonal Distributions Realized Habitats of Seasonal Distributions Seasonal Stratified Area Weighted Catch Per Unit Effort
Catch Weighted Latitude of Seasonal Distributions Realized Habitats of Seasonal Distributions Seasonal Stratified Area Weighted Catch Per Unit Effort
Catch Weighted Latitude of Seasonal Distributions Realized Habitats of Seasonal Distributions Seasonal Stratified Area Weighted Catch Per Unit Effort
Catch Weighted Latitude of Seasonal Distributions Realized Habitats of Seasonal Distributions Seasonal Stratified Area Weighted Catch Per Unit Effort
Catch Weighted Latitude of Seasonal Distributions Realized Habitats of Seasonal Distributions Seasonal Stratified Area Weighted Catch Per Unit Effort
“The U.S. GLOBEC Georges Bank Program [1994-1999]is a large multi- disciplinary multi-year oceanographic effort. The proximate goal is to understand the population dynamics of key species on the Bank - Cod, Haddock, and two species of zooplankton (Calanusfinmarchicus and Pseudocalanus) - in terms of their coupling to the physical environment and in terms of their predators and prey. The ultimate goal is to be able to predict changes in the distribution and abundance of these species as a result of changes in their physical and biotic environment as well as to anticipate how their populations might respond to climate change.”
From: “A synthesis of large-scale patterns in the planktonic prey of larval and juvenile cod (Gadusmorhua)” Heath and Lough 2007
Four Index Areas to Characterize Cod, Pseudocalanusspp, and C. finmarchicusCPUE Georges Bank (GB), Northern GOM (NGOM), Southern GOM (SGOM), Southern New England (SNE)
Normalized spring cod, Pseudocalanusspp, and C. finmarchicus CPUE
Summary There has been a condensation of the principal thermal habitats (5-15°C) of the Northeast Shelf ecosystem, and an expansion of the warm water thermal habitats (16-27°C). The condensation of principal habitats has been intensified by the maintenance of cold water habitats (1-4°C) in the system. Lower trophic level organisms, comprising species that are the principal prey of the early life forms of upper trophic level organisms, have responded to the change in thermal habitat. Moist notably, the copepod Pseudocalanusspp has declined in abundance commensurate with a reduction of their thermal habitat. Pseudocalanussppalong with Calanusfinmarchicusare the principal prey of larval cod. The recruit/SSB ratio for cod has declined for the Gulf of Maine stock and is difficult to interpret for the Georges Bank stock. A finer scale spatial analysis suggests that where Pseudocalanusspphas declined cod has not responded to management measures and where Pseudocalanusspphas remained abundant, cod has recovered to higher stock levels.