Download
1 / 6
60 likes | 177 Vues
This informative sheet explains Z-scores, which are standardized measures that compare individual student or school data to state averages. A Z-score is calculated using the formula: (Student Scale Score - Statewide Average Scale Score) / Standard Deviation of Scale Score for students and similarly for schools. Z-scores center around zero; positive values indicate performance above average, while negative values signify below-average performance. Practical examples illustrate how to interpret Z-scores, helping educators and stakeholders gauge academic achievement relative to state standards.

E N D
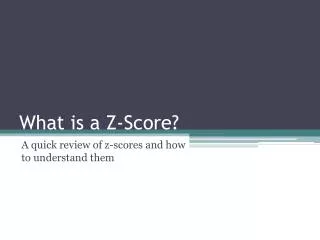
What is a Z-Score? A quick review of z-scores and how to understand them
Z-Score “Information Sheet” • Z-scores are a standardized measure that helps you compare individual student (or school) data to state average data. Student z-score = (Student Scale Score) – (Statewide average of scale scores) Standard Deviation of Scale Score School z-score= (School Value) – (Statewide average of that value) Standard deviation of that value
Z-Score “Information Sheet” • Z-scores are centered around zero • Positive numbers mean the student or school is above the state average • Negative numbers mean the student or school is below the state average State Average …Worse than state average Better than state average…. 1 -3 -2 0 2 3 -1
Z-Score Examples • Your school has a z-score of 1.5. You are better than the state average. Z-score of 1.5 State Average …Worse than state average Better than state average…. 1 -3 -2 0 2 3 -1
Z-Score Examples • Your school has a z-score of .2. You are better than the state average, but not by a lot. Z-score of 0.2 Z-score of 1.5 State Average …Worse than state average Better than state average…. 1 -3 -2 0 2 3 -1
Z-Score Examples • Your school has a z-score of -2.0. You are very far below state average. Z-score of -2.0 Z-score of 0.2 Z-score of 1.5 State Average …Worse than state average Better than state average…. 1 -3 -2 0 2 3 -1