Download
1 / 10
100 likes | 118 Vues
Help your mid-market clients optimize their business performance with tailored business intelligence solutions, improving reporting, decision-making, and productivity.

E N D
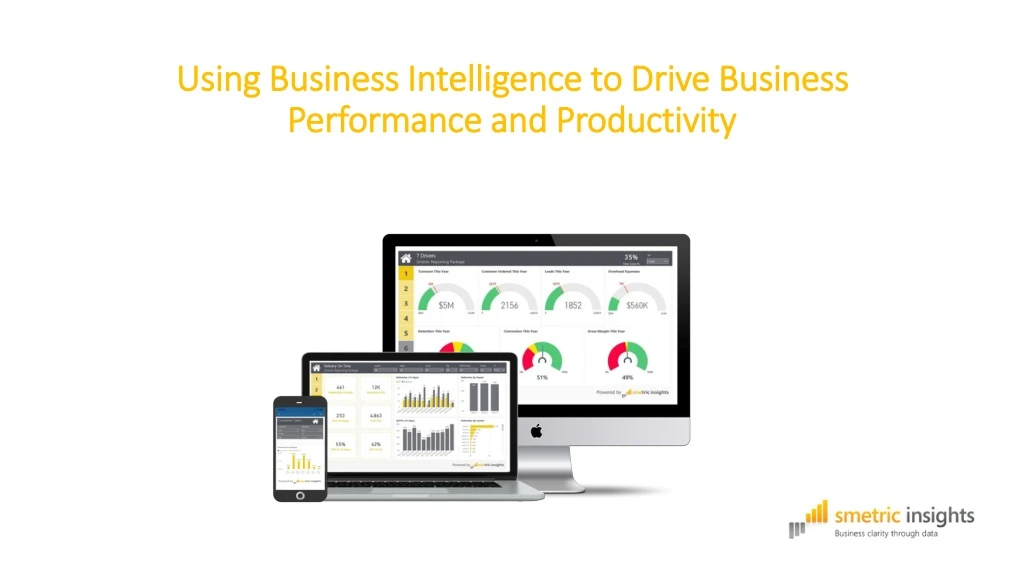
Using Business Intelligence to Drive Business Performance and Productivity
Your Mid-Market Clients Problems • They have data everywhere, in multiple systems - See Appendix I • The reporting out of their software is often poor • They are using Excel for reporting and and are tangled up in multiple versions of the truth, from various information sources • Cookie cutter solutions don’t work at this level. See why - Appendix II • They don’t employ data science, engineer, or analyst capability
Take Your Clients’ Businesses to a New Level Use business intelligence to help clients find focus on the areas that really matter • Provide focus to open up advisory opportunities with clients • Increase revenue per client • Move beyond the “cookie cutter” solutions and stand out from the rest • Become a industry leader with tailored BI solutions. • Jump start your journey today
Provide Clients With a Better Solution Imagine your clients starting the day with their teams having absolute clarity on where to focus their time and energy with… • Automated dashboards, all in one place • Focus on improving the numbers, not finding them • Faster, better decisions • Improved clarity and accountability • Highly engaged teams • Spot opportunities to grow sales • Improved customer experience • Optimise operations and release cash “Focus on shifting the needle every day”
BI Projects That We Are Doing in the Mid-Market • Retail and finance - $20 to $30m revenues • Transport business - $5-$10m revenues • FMCG distributor - $10 to $15m revenues • Import/distributor of building products - $5m to $10m revenues • FMCG Distributor - $10 to $15m revenues, two companies • Transport business - $5m+ revenues • Shopfitting business - $20m+ revenues We connect provide hourly or daily reporting over an average of 4 different systems
The Challenges for CA Firms in the Mid-Market • Some have enterprise level data services but unaffordable for the mid-market. • Some view “lite” BI such as Futrli, Spotlight etc as “real” BI • Some have become frustrated with Power BI’s “out of the box” connecters which are very limited e.g. Xero, QBO. No connecters for some software e.g. Cin7, WorkflowMax, MYOB Advanced, Accredo etc. • Don’t have a team of data scientists, engineers, and analysts to do BI
Appendix I - Software Used in the Mid-Market Xero with Add-ons is moving into the mid-market Reporting out these systems is limited Businesses are using spread sheets because these systems can’t cope
Some Apps Used by the Mid-Market What if you want to see all of your data in once place and share data with clients and suppliers?
Appendix II – “Lite BI” Challenges of software we have used and reviewed • Mid market business want to see data how they want it – not “Cookie Cutter” • Mostly are financially focused on P & L and B S historical performance • Some have three way forecasting capability that is a challenge to use • Limited integrations for non financial data other than loading CSV files and other accounting software • Most can’t drill down deep to transactional data • Focused more on monthly reporting of key KPIs versus hourly, daily, and weekly • Inflexibility to make changes to reporting • Online real time access for clients. Some you send PDF reports to clients • Set up time for mapping of account codes can be time consuming
Warwick Russell CEO Smetric Insights Email: warwick@smetric.co.nz Phone: +64 9 522 4938 Mobile: +64 21 951 076 www.smetricinsights.com Auckland | Melbourne