Download
1 / 22
220 likes | 233 Vues
This module provides students with the knowledge and skills to analyze race and gender inequality in income using data from the American Community Survey. Through reading frequencies and bivariate tables, students learn to make data-based comparisons across states and write a cohesive story about income inequality. The module includes hands-on exercises and activities to enhance quantitative skills.

E N D
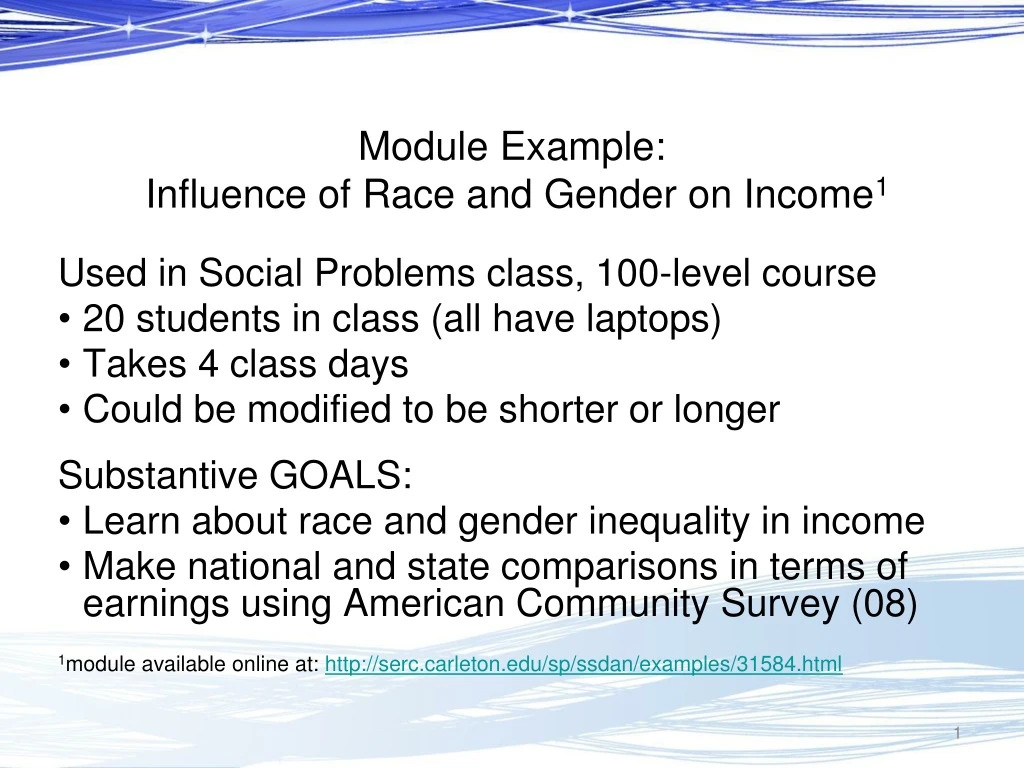
Module Example: Influence of Race and Gender on Income1 Used in Social Problems class, 100-level course • 20 students in class (all have laptops) • Takes 4 class days • Could be modified to be shorter or longer Substantive GOALS: • Learn about race and gender inequality in income • Make national and state comparisons in terms of earnings using American Community Survey (08) 1module available online at: http://serc.carleton.edu/sp/ssdan/examples/31584.html
Quantitative Skills Acquired: Students will: • Create and read frequency tables • Learn logic of independent and dependent variables • Create and interpret bivariate tables/cross-tabs • Learn to make data-based comparisons across states • Read and write a “story” about income inequality using data as evidence
Day 1: How to Read Frequencies in a Handout [First, define and examine sample and variables] Reading Frequencies: Example 1: ACS sample of US full-time, year-round workers in 2008. What is the sex composition of the fulltime workforce? Points to make to students about a frequency table: • Have both percentages and numbers • To make comparisons, we will usually focus on the percentages • Percentages should add up to 100% • Must understand base (all full-time year-round workers in 2008)
Day 1: Start by Learning How to Read Frequencies in a Handout Test for common mistakes: Sex Composition of Full-Time, Year-Round Workers, 2008 Which of the following is true? • 58.7% of the workforce is male. • 58.7% of men are in the workforce. Answer: A is correct.
Day 1: Reading Frequencies Example 2: examine earnings of full-time workers Start by asking students to guess: What percent of full-time workers earn over $100,000? What percent earn less than $15,000? Table 2: Earnings for Full-Time Year-Round Workers, US, 2008
After frequencies, examine bivariate tables • Now ask students to guess: Who makes more, men or women? • How might we determine that? • Show a bivariate table of sex and income, and ask them to interpret:
Day 1: Reading a Bivariate Table Earnings by Sex, ACS 2008 • Must determine how to read this table – where to focus? • Teach students to focus on top and bottom portions for comparisons
Day 1: Learn How to Read Bivariate Table Earnings by Sex, ACS 2008 • Test for common mistakes: True or False? • 14% of those who make between $15,000 and $24,000 are men. • False • 14% of men make between $15,000 and $24,000. • True • 25.1% of men earn more than $70,000 • True • 17.2% of men and women earn more than $100,000 • False
Day 1: Learn How to Read Bivariate Table Earnings by Sex, ACS 2008 • Give Rules for reading table (included in module materials) • Start with general statement; use percentages as evidence; end with summary • Teach students useful phrases: • e.g. “A disproportionately high percentage of women fall into the low-income categories. For example, ….” • Most important take-home message: Emphasize “telling a story” with numbers
Day 2: Students Run Module in Class (or could do as homework) • Module will walk students through an exercise, step by step, for a state of their own choosing to examine • sex earnings • race earnings • Learn independent and dependent variables • Make hypotheses about relationship between variables • Learn how to run frequencies and set up simple bivariate tables • Learn how to create properly labeled tables from the data generated • Write a story about income and sex differences in income
Handout with Module • http://ssdan.net/webchip/webchip4/ • Examine individual state: KY • racial and sex composition of workforce (frequencies) • Differences in earnings by sex and race (cross-tabs)
Handout with Module • http://ssdan.net/webchip/webchip4/ • Choose state and examine: • racial and sex composition of workforce (frequencies) • Differences in earnings by sex and race (cross-tabs)
Day 3: Learn How to Present Data • Students work in pairs on state of own choosing • 5-minute presentation of findings to class: • Give hypothesis (and let others guess) • Show table of results • Describe findings with proper language
Day 4: Peer Review of Paper • Students come to class with completed draft of data analysis paper • In pairs, review and edit one another’s papers, following guided prompts • Main goal: students learn to write “story” using data as evidence
Assessment A) Used 2 forms of assessment a) pre/post-test b) paper, graded by rubric B) Tried to assess both skills and confidence levels
Comparison of Pre-test to Post-test (past four years) Overall score on pre-test : 55 - 60% Overall score on post-test: 80 - 94% Assessment of Pre and Post-test: • Great improvement in basic skills at reading and interpreting exactly this kind of table • Improved confidence in working with data and numbers
Assessment of Paper: • Demands higher-order skills: difficult paper • Skills vary quite a bit • Peer review helpful • Allow re-writes for students with most trouble • Students report that paper is difficult, but worth it
Comments on Student Evals • “I worked a lot in this class, and was always taken to the brink of overwhelmed but not crossing over. I think this is a sign of an excellent class. The data analysis we did was a particular challenge. I came away from the exercise knowing I learned something completely out of my comfort zone.” • “Keep on trying with the Data Analysis.... we (students) need it... no matter how badly we do not like it at first.”
Overview of Module • Have been using for several years, recently updated with 2008 American Community Survey data • Cheerleading helps – keep telling them they’re learning useful skills • Fun to teach– hands-on activity; improves own engagement in teaching these content areas • Students generally enjoy (positive evals) • Pre/post test shows students learn skills • Exams and papers show modules reinforces content [truly see race and gender inequality] • See evidence of skills in later courses
Benefits of Including Data Analysis in Classes • Piques student interest in content • Promotes content retention through active learning • Engages students in the discipline: • - shows how social scientists work • - prevents “disconnect” between substantive and technical courses • Meets larger institutional goals • Subsequent courses continue building on these skills
Final overview: what this module includes: • Two hand-outs : • Handout 1: explanations of variables and descriptions for how to read frequencies and bivariate tables (used first day) • Handout 2: step by step instructions for students to go online and examine data for individual states; includes assignment for final paper (used second day) • Ancillary materials: • T/F test to catch common mistakes • List of “rules” for reading and writing about tables (good to create own rules as well) • Peer review guidelines • Rubric for evaluating paper • Pre- and post-test for assessing student learning