2 problems to work out right now
170 likes | 384 Vues
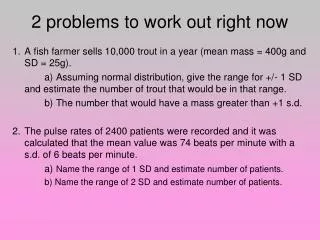
2 problems to work out right now. 1. A fish farmer sells 10,000 trout in a year (mean mass = 400g and SD = 25g). a) Assuming normal distribution, give the range for +/- 1 SD and estimate the number of trout that would be in that range.

2 problems to work out right now
E N D
Presentation Transcript
2 problems to work out right now 1. A fish farmer sells 10,000 trout in a year (mean mass = 400g and SD = 25g). a) Assuming normal distribution, give the range for +/- 1 SD and estimate the number of trout that would be in that range. b) The number that would have a mass greater than +1 s.d. 2. The pulse rates of 2400 patients were recorded and it was calculated that the mean value was 74 beats per minute with a s.d. of 6 beats per minute. a) Name the range of 1 SD and estimate number of patients. b) Name the range of 2 SD and estimate number of patients.
Why t-test? Are our results reliable enough to support a conclusion?
128 140 Imagine we chose two students at random from two class rooms… … and compare their height …
128 140 … we find that one student is taller than the other WHY?
128 140 There is a significant difference between the two groups, so students in 140 are taller than students in 128 REASON 1: YEAR 9 YEAR 11
128 140 John Anthony (Year 9) (Year 9) By chance, we picked a short student from 128 and a tall one from 140 REASON 2:
How do we decide which reason is most likely? MEASURE MORE STUDENTS!!!
128 140 If there is a significant difference between the two groups… … the average or mean height of the two groups should be very… … DIFFERENT
128 140 If there is no significant difference between the two groups… … the average or mean height of the two groups should be very… … SIMILAR
Living things normally show a lot of variation, so… Remember:
128 Sample 140 Sample Average height = 168 cm Average height = 162 cm It is VERY unlikely that the mean height of our two samples will be exactly the same Is the difference in average height of the samples large enough to be significant?
16 16 128 Sample 14 14 12 12 10 10 Frequency Frequency 8 8 6 6 4 4 2 2 180-189 160-169 140-149 140-149 160-169 170-179 150-159 170-179 150-159 Height (cm) 140 Sample 180-189 Height (cm) We can analyse the spread of the heights of the students in the samples by drawing histograms Here, the ranges of the two samples have a small overlap, so… … the difference between the means of the two samples IS probably significant.
16 16 128 Sample 14 14 12 12 10 10 Frequency Frequency 8 8 6 6 4 4 2 2 180-189 160-169 140-149 140-149 160-169 170-179 150-159 170-179 150-159 Height (cm) 140 Sample 180-189 Height (cm) Here, the ranges of the two samples have a large overlap, so… … the difference between the two samples may NOT be significant. The difference in means is possibly due to random sampling error
To decide if there is a significant difference between two samples we must compare the mean height for each sample… … and the spread of heights in each sample. Statisticians calculate the standard deviation of a sample as a measure of the spread of a sample Student’s t-test The Student’s t-test compares the averages and standard deviations of two samples to see if there is a significant difference between them. We start by calculating a number, t
C1: x1 = D8: x2 = Worked Example: Random samples were taken of pupils in 128 and 140 Their recorded heights are shown below… Step 1: Work out the mean height for each sample 161.60 168.27 Step 2: Work out the standard deviation for each sample C1: s1 = 10.86 D8: s2 = 11.74
(s2)2 (s1)2 = + n2 n1 t = 6.67 = 4.13 x2 – x1 Step 3: Calculate t (or find given value of t) 1.62 Step 4: Work out the number of degrees of freedom d.f. = n1 + n2 – 2 = 15 + 15 – 2 = 28
Step 5: Find the critical value of t for the relevant number of degrees of freedom Use the 95% (p=0.05) confidence limit Critical value = 2.05 Our calculated value of t is below the critical value for 28d.f., therefore, there is no significant difference between the height of students in samples from 128 and 140