Greenhouse
PISA type question. Greenhouse. Starter – discuss now. What do you know Carbon dioxide?. Unistructural. State the relationship between Carbon dioxide levels and global warming?. 01 January 2020. 01 January 2020. PISA - greenhouse. Review.

Greenhouse
E N D
Presentation Transcript
PISA type question Greenhouse
Starter – discuss now What do you know Carbon dioxide? Unistructural State the relationship between Carbon dioxide levels and global warming?
01 January 2020 01 January 2020 PISA - greenhouse Review State the relationship between carbon dioxide levels and global warming. Analyse and interpret data on CO2 emissions and Earth’s temperature. Draw scientific conclusions which are consistent with evidence. Explain the greenhouse phenomenon scientifically. Keywords: CO2, greenhouse, temperature
Task 1: Source square Multi structural and Relational Analyse and interpret data on CO2 emissions and Earth’s temperature.
Analyse and interpret data • André concludes from these two graphs that it is certain that the increase in the average temperature of the Earth’s atmosphere is due to the increase in the carbon dioxide emission. • Do you agree with André’s conclusion? • Does the evidence support his conclusion? Analyse and interpret data on CO2 emissions and Earth’s temperature. Multi structural and Relational
Compare In 1980–1983 carbon dioxide went down and….. In 1900–1910 (about) CO2 was increasing, whilst… André concludes from these two graphs that it is certain that the increase in the average temperature of the Earth’s atmosphere is due to the increase in the carbon dioxide emission. Between 1950 and 1980 the temperature ……….. The temperature in the 1800s is ……. Draw scientific conclusions which are consistent with evidence. Relational
Compare In 1980–1983 carbon dioxide went down and the temperature rose. In 1900–1910 (about) CO2 was increasing, whilst the temperature was going down. André concludes from these two graphs that it is certain that the increase in the average temperature of the Earth’s atmosphere is due to the increase in the carbon dioxide emission. Between 1950 and 1980 the temperature didn’t increase but the CO2 did. The temperature in the 1800s is much the same but the first graph keeps climbing. Draw scientific conclusions which are consistent with evidence. Relational
Task 2: Golden sentence • Skim read through the text and highlight! (2 min) • Working in small groups, you must present a ‘golden sentence’ summary of your given paragraph (5 min). • How did you develop your summary (e.g. keywords, skimming, scanning, etc.)? • Are all the golden sentences relevant to be able to draw a conclusion? • What is your overall conclusion now?
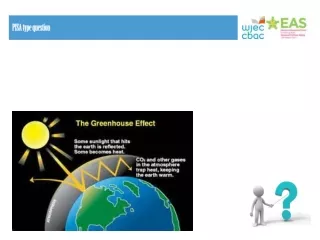
Task 3: Questions Attempt the greenhouse PISA task in your groups. • The PISA Questions • What is it about the graphs that supports André’s conclusion? • Give an example of a part of the graph which doesn’t support André’s conclusion. Explain your answer. • Name one other factor which may affect the greenhouse effect. KEYWORDS: Carbon dioxide, emissions, Sun’s radiation, Water vapour, Atmospheric pollution Extended Abstract Explain the greenhouse phenomenon scientifically.
5.1 - No credit: • Responses that refer to the increase of either the (average) temperature or the carbon dioxide emission. • The temperature has gone up. • CO2 is increasing. • It shows the dramatic change in temperatures. • Responses that refer to temperature and carbon dioxide emission without being clear about the nature of the relationship. • The carbon dioxide emission (graph 1) has an effect on the earth’s rising temperature (graph 2). • The carbon dioxide is the main cause of the increase in the earth’s temperature.
Question 5.1 - Analysing and interpreting data to draw scientific conclusions consistent with evidence. • Responses that refer to the increase of both (average) temperature and carbon dioxide emission. • As the emissions increased the temperature increased. • Both graphs are increasing. • Because in 1910 both the graphs began to increase. • Temperature is rising as CO2 is emitted. • The more CO2 emission, the higher the temperature.
Question 5.1 - Analysing and interpreting data to draw scientific conclusions consistent with evidence. • Responses that refer to the increase of both (average) temperature and carbon dioxide emission. • As the emissions increased the temperature increased. • Both graphs are increasing. • Because in 1910 both the graphs began to increase. • Temperature is rising as CO2 is emitted. • The more CO2 emission, the higher the temperature.
5.2 - No credit: • Responses that refer to an irregularity in a curve without referring specifically to the two graphs. – It goes a little up and down. – It went down in 1930. • Responses that refer to a poorly defined period or year without any explanation. – The middle part – 1910. • Missing. – In 1940 the average temperature has increased, but not the carbon dioxide emission. – Around 1910 the temperature has increased but not the emission.
Question 5.2 - Analysing and interpreting data to draw scientific conclusions consistent with evidence. • In 1900–1910 (about) CO2 was increasing, whilst the temperature was going down. • In 1980–1983 carbon dioxide went down and the temperature rose. • The temperature in the 1800s is much the same but the first graph keeps climbing. • Between 1950 and 1980 the temperature didn’t increase but the CO2 did. • From 1940 until 1975 the temperature stays about the same but the carbon dioxide emission shows a sharp rise.
Question 5.2 - Analysing and interpreting data to draw scientific conclusions consistent with evidence. • Responses that refer to one particular part of the graphs in which the curves are not both descending or both climbing and gives the corresponding explanation, such as: • In 1900–1910 (about) CO2 was increasing, whilst the temperature was going down. • In 1980–1983 carbon dioxide went down and the temperature rose. • The temperature in the 1800s is much the same but the first graph keeps climbing. • Between 1950 and 1980 the temperature didn’t increase but the CO2 did.
5.3 - No credit: • Responses that refer to a cause that influences the carbon dioxide concentration. – Clearing of rain forest. – The amount of CO2 being let off. – Fossil fuels • Responses that refer to a non-specific factor. – Fertilisers. – Sprays. – How the weather has been. • Other incorrect factors or Missing. – The amount of oxygen. – Nitrogen. – The hole in the ozone layer is also getting bigger.
Question5.3 - Explaining phenomena scientifically. Responses that give a factor referring to the energy/radiation coming from the Sun. – The sun heating and maybe the earth changing position. – Energy reflected back from the Earth. (Assuming that by ‘Earth’ the student means ‘the ground’). • Responses that give a factor referring to a natural component or a potential pollutant. – Water vapour in the air. – Clouds. – The things such as volcanic eruptions. – Atmospheric pollution (gas, fuel). – The amount of exhaust gas. – CFCs. – The number of cars. – Ozone (as a component of air).
Question5.3 - Explaining phenomena scientifically. Responses that give a factor referring to the energy/radiation coming from the Sun. – The sun heating and maybe the earth changing position. – Energy reflected back from the Earth. (Assuming that by ‘Earth’ the student means ‘the ground’). • Responses that give a factor referring to a natural component or a potential pollutant. – Water vapour in the air. – Clouds. – The things such as volcanic eruptions. – Atmospheric pollution (gas, fuel). – The amount of exhaust gas. – CFCs. – The number of cars. – Ozone (as a component of air).
Pair Think Share Think – Pair - Share • What clues did you find in the question stems that pointed you towards using the information given? • What requires you to draw on your previous experience/knowledge?
Think – Pair - Share • What clues did you find in the question stems that pointed you towards using the information given? • What requires you to draw on your previous experience/knowledge? What I already know: What my partner knew which I didn’t: What the class knew which I didn’t:
Task4: Reflection triangle • What is this task about? • How do you know? • Where have you used a strategy like this before? • How did you extract the information you needed? • How will you identify and summarise the key ideas to answer this question?
How will they help you solve problems? How useful were they in helping you solve the problem? Why? When might you use these strategies again? What strategies did you use? How did you work?
How did you recognise that the strategies would be useful? Which strategies did you use? Reading Discussion Listening Classifying Diagrams Using models How did they help you to solve the problem? Which was better? Why? Individually? Groups?
01 January 2020 PISA - Greenhouse Review State the relationship between carbon dioxide levels and global warming. Analyse and interpret data on CO2 emissions and Earth’s temperature. Draw scientific conclusions which are consistent with evidence. Explain the greenhouse phenomenon scientifically. Keywords: CO2, greenhouse, temperature