Download
1 / 29
290 likes | 426 Vues
This comprehensive analysis by R. Steven Nerem, a researcher at the University of Colorado, examines the factors contributing to contemporary sea level changes, including thermal expansion, melting glaciers, and polar ice loss. It provides insights into global mean sea level change, measurement techniques, and varying local impacts. The findings highlight the complexities of predicting future sea levels due to climate inertia and the roles of Greenland and Antarctica. Continued satellite observations are essential for a clearer understanding of future trends.

E N D
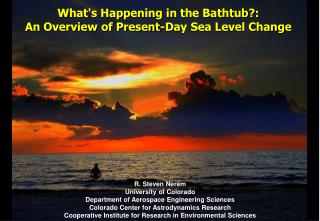
New Developments in Present-Day Sea Level Change R. Steven Nerem Colorado Center for Astrodynamics Research Cooperative Institute for Research in Environmental Sciences University of Colorado at Boulder
The Earth is WarmingAnnual Global Mean Surface Temperatures [Hansen et al., 2005]
The Bathtub Sea Level Model Precipitation over Oceans Runoff from Continents + - Evaporation from Oceans Precipitation over Continents
What is Global Mean Sea Level Change? • “Global Mean Sea Level Change” is the change in the average height of the oceans over the entire globe at a single point in time. • Sea level change at a specific location in the ocean may be higher or lower than the global mean because of differences in ocean temperature and other effects. • Usually measured in units of millimeters (mm): 25.4 mm = 1 in • Does not include ocean tides, storm surge
Land Movement Can Affect Sea Level LocallyInSAR Image of Subsidence in New Orleans mm/yr [Dixon et al., 2006]
Measurements of Sea Level Change GRAVITY
Tide Gauge Sea Level Measurements Tide Gauges with Greater Than 10 Years of Measurements Tide Gauges with Greater Than 50 Years of Measurements
Tide Gauge Observations 3.2 mm/year 2.0 mm/year 0.8 mm/year Average Rate ~ 1.8 mm/year [Church and White, 2006]
Satellite Altimeters Jason-1 2001 - ? TOPEX/Poseidon 1992-2005 OSTM/Jason-2 2008
Global Mean Sea Level from Satellite Altimetry Average Rate = 3.5 mm/year (1993-2006) 1997-1998 El Nino [Mitchum and Nerem, 2007]
Sea Level Change is Not the Same EverywhereAverage Sea Level Rise over 1993-2006 mm/yr
Sea Level Change Potential Contributions Thermal Expansion: ~1 meter Mountain Glaciers: 0.5 meters Greenland Ice Melt: 7 meters Antarctic Ice Melt: 60 meters Land Water Storage: < 0.5 meters
Thermal Expansion: Contribution to Sea Level Rate = 0.4 mm/year (1955-2004) Rate = 1.2 - 1.6 mm/year (1993-2004) Mt. Pinatubo [Levitus et al., 2005; Antonov et al., 2005]
Mountain Glaciers: Contribution to Sea Level 1961-2003: 0.5 mm/year 1994-2003: 0.9 mm/year [Dyurgerov and Meier, 2005]
Greenland Ice Mass Loss from GRACE 362 Gt = 1 mm GMSL -140 Gt/year = 0.4 mm/year GMSL Credit: Roger Braithwaite [Luthcke et al., 2006]
Antarctic Ice Mass Flux from InSAR SLR 0.4 to 0.6 mm/yr -4 km3/yr -2 km3/yr -2 km3/yr +5 km3/yr -37±20 km3/yr -2 km3/yr -3 km3/yr -49±20 km3/yr +48 km3/yr -38 km3/yr -4 km3/yr -114 km3/yr -22 km3/yr -56 km3/yr +33 km3/yr -33 km3/yr +21 km3/yr [Rignot, 2005] +5 km3/yr
Sea Level Budget (IPCC, mm/year) 1993-2003 1961-2003 Thermal Expansion 1.6 ± 0.5 0.4 ± 0.1 + Mountain Glaciers 0.8 ± 0.2 0.5 ± 0.2 + Greenland Ice Melt 0.2 ± 0.1 0.1 ± 0.1 + Antarctic Ice Melt 0.2 ± 0.3 0.1 ± 0.4 Land Water Storage ? ? = Total of Observed Contributions 2.8 ± 0.7 1.1 ± 0.5 Observed Sea Level Change 3.1 ± 0.7 1.8 ± 0.5
Is Sea Level Rise Accelerating? • Short answer: probably • The satellite sea level record is too short (~14 years) to rule out that the recent rise is due to natural decadal variability. • This is only likely to be resolved by having a longer satellite data record (~30 years). • The decline in satellite programs in recent years has put this in jeopardy.
Sea Level Observations versus Predictions Satellite Observations Tide Gauge Observations Climate Model Predictions (IPCC 3rd Assessment, 2001) [Rahmstorf et al., 2007]
What to Expect in the Future • Future sea level predictions are uncertain because of uncertainties in the contributions of Greenland and Antarctica. • The IPCC 4th Assessment projects 0.28 - 0.59 m of sea level rise by 2100, but did not exclude higher rates. • In fact, a recent study suggests higher rates (0.5 - 1.4 m by 2100). 5.8° 1.4° [Rahmstorf, 2007] • Even if greenhouse gases were stabilized now, substantial sea level rise would continue for several centuries because of inertia in the climate system (~ 0.1 - 0.25 m/century).
Summary • Observations of sea level change are consistent with how we expect sea level to respond in a warming climate. • Sea level rose faster in the last decade than the 20th century average. • Whether the current rate of rise is accelerating can only be resolved with longer satellite time series. • Presently, ocean warming, melting of mountain glaciers, and melting of the polar ice caps are contributing in roughly equal amounts to the observed rise. • The largest uncertainty in future sea level rise projections is the contribution of Greenland and Antarctica. • Many of the remaining questions about sea level rise can only be answered with continued satellite measurements, which are in serious jeopardy.
Greenland Ice Mass Loss Estimates Luthcke et al. [2006] Krabill et al. [2004] Zwally et al. [2005] Rignot et al. [2006] Velicogna and Wahr [2005] Ramillien et al. [2006] Chen et al. [2006] Velicogna and Wahr [2006] Mass Loss 362 Gt = 1 mm GMSL [Cazenave, 2006]
Antarctic Ice Mass Loss Estimates Rignot and Thomas [2002] Zwally et al. [2005] Davis et al. [2005] Velicogna and Wahr [2006] Chen et al. [2006] Ramillien et al. [2006] 362 Gt = 1 mm GMSL [Cazenave, 2006]
Sea Level Budget (1993-2006) Thermal Expansion: 1.2 - 1.6 mm/year + Mountain Glaciers: ~0.6 - 1.0 mm/year + Greenland Ice Melt: ~0.2 - 0.5 mm/year + Antarctic Ice Melt: ~0.2 - 0.4 mm/year Land Water Storage: ? = Total: 2.2 - 3.5 mm/year Observed by Satellites
Alaska Glacier Mass Changes from GRACE Sea Level Contribution of 0.3 mm/year over 2002-2004 [Tamisiea et al., 2005]
Effects of Sea Level Rise 2 meters 1 meter 4 meters 8 meters GFDL