Download

1 / 13
130 likes | 231 Vues
The workshop evaluated promoter prediction tools like McPromoter1, McPromoter2, Fprom, DBTSS, FirstEF, Dragon Gene Start Finder, and Dragon Promoter Finder used by ENCODE and non-ENCODE participants. They analyzed performance on known genes with CDS data and advocated for better metrics in testing. Results showed improved predictions using stricter distance constraints. Future strategies include combining TSS predictors with gene-finding programs for enhanced accuracy. The workshop aims for specialized TSS finding systems with high positional accuracy.

E N D
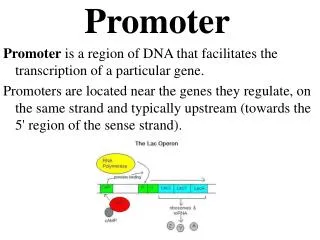
ENCODE Workshop 2005 at Sanger Institute Promoter prediction assessment by Vladimir B Bajic
Predictors • ENCODE participants (3): • 7-80-8 (McPromoter1) • 7-81-8 (McPromoter2) • 41-108-8 (Fprom) additional predictors • Beyond ENCODE participants (4) (out of competition) • DBTSS (reference experimental dataset of capped flcDNA) • FirstEF • Dragon Gene Start Finder • Dragon Promoter Finder
Goals • How good are promoter predictors? • Does performance change on this dataset? • Implications for future developments
Data (1) Category “Known genes with CDS” (category = 2) • 1061 annotated transcripts • 1009 -> 994 unique starts of transcripts (TSSs) • 319 unique TSSs in Encode ‘training’ set (13 regions) • 675 unique TSSs in Encode test set • Length of ENCODE regions 29,998,060 bp • Length of ‘training’ regions 8,538,447 bp • Length of testing regions 21,459,613 bp
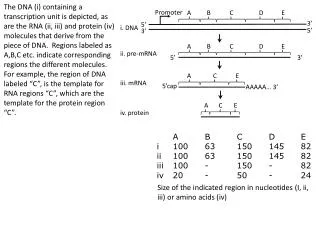
Method for counting TP and FP All hits to ‘orange’ count as FPs Only one hit within A, B, or C counts as TP for unique position of TSS (3 hits within C will count only as 1 TP) Only minimum distance from all TSSs counts
Results • Different measures of success • Test ENCODE regions • Also: comparison with other participants (test + all regions)
Comments • Compared to previous whole human genome analysis, now we use a more strict distance constraint: max allowed distance 1000 nt (vs. previous 2000 nt) • Previously: Se [0.4 – 0.8], ppv [0.25 – 0.67] • Now, for experimental DBTSS data: • Positional error ~100 nt, Se 0.61, ppv 0.93 • Computational promoter prediction (CPP) (using single genome, no transcripts): positional error 200-300 nt (2-3 fold larger than DBTSS) (positive surprise) • Se [0.32-0.62] (negative surprise but expected) • (reason poor G+C content of some of the test regions) • CPP: ppv >80 (in some cases >90%) (positive surprise) • Having in mind the type of information used for ab initio promoter finding, we see no dramatic difference in 5’ end prediction by methods class 1 and 3, and CPP (positive surprise); however, Se and ppv are better with methods of class 1 and class 3 for obvious reasons.
Future developments • Combine TSS predictors and gene finding programs or transcript info (positive effects of this are visible in Fprom, 20-76-4 and 20-76-5, since in these cases the TSS search space is effectively restricted) • This, however, requires retuning of TSS predictors and some change in their design philosophy • Expected performance should be similar or better than in class 1 and class 3 systems as TSS finding systems should be more specialized for the 5’end type of signals • More emphasis should be given to positional accuracy of TSS predictors
Thank you for your time You may wake up now