Download
1 / 71
710 likes | 868 Vues
Spectroscopic Studies of z~5.7 and z~6.5 Galaxies: Implications for Reionization. Esther Hu University of Hawaii, Institute for Astronomy IAU Colloq. 199, Shanghai 18 March 2005. Overview. Scientific Motivation for Studies Ly Emission-Line Galaxy Surveys

E N D
Spectroscopic Studies of z~5.7 and z~6.5 Galaxies: Implications for Reionization Esther Hu University of Hawaii, Institute for Astronomy IAU Colloq. 199, Shanghai 18 March 2005
Overview • Scientific Motivation for Studies • Ly Emission-Line Galaxy Surveys Depth, area requirements for large high-redshift samples Current status • Luminosity Functions at z~5.7, z~6.5 • Line Profiles at z~5.7, z~6.5 • Structured Distribution of High-z Galaxies • Summary Conclusions Collaborators: Len Cowie, Peter Capak, Yuko Kakazu
Lyman alpha emitters atz = 5.7 versus z = 6.5 Did the intergalactic hydrogen reionize at z just beyond 6 ? Or was it earlier? Can we find galaxies at these redshifts ? Are there enough of them to ionize the gas? What can we infer about IGM evolution from these galaxy populations? Is reionization at z=6 consistent with the galaxy observations?
Question : H REIONIZATION at z~6.2 ??? Or is it just the natural thickening of the Lyman alpha forest as we move to high redshift? VERY HARD to tell the difference between an optical depth of 10 and one of 10000! ALTERNATE TEST: is there a change in the Lya line properties of galaxies across this redshift boundary -- either a change in the luminosity function or in the properties of the lines that might show they were now living in a mostly neutral medium where the Lya line is cut away by the damping wings of the IGM?
High redshift galaxies We need to develop large well selected samples in the z=5 7 redshift range to answer this question…. And also-- How does initial structure formation and reionization take place? Is ionization at this redshift produced by high redshift AGN? star-forming galaxies? What is the history of star formation in the Universe in the z=5 7 range?
Currently the only method which can turn up large homogeneously selected samples at these redshifts are Lya searches with narrow-band filters or direct spectroscopic techniques (Hu et al 2002, Taniguchi et al. 2004, Ellis et al 2004) z = 6.6, ~7 Other possibilities are red color selection and targeted observations of X-ray, radio or far infrared selected sources but there are very few objects so far…. How can we find galaxies at these redshifts?
High redshift galaxies Need many very large fields Objects are sparse at brighter magnitude (few hundred per square degree for AB <25.5) Fields are highly correlated on subdegree scales Capak et al. 2004, Brodwin et al.2003 (astro-ph/0310038)
(Z=6.6) (Z=5.7) HK’, J, Z’, 9130/125, I, 8150/120, R, V, B, U Total area just over a square degree Spectroscopy of all X-ray and radio sources , all z=5.7 and 6.6 emission line candidates and all red color selected objects together with large magnitude selected field samples Hawaii survey: wide field color and narrow band mapping at z=57 Peter Capak, Esther Hu, Len Cowie, Amy Barger, Richard McMahon, Yuko Kakazu, Wei-Hao Wang, Tomoki Hayashino, Yutaka Komiyama, Ed Fomalont, Niel Brandt, Dave Alexander, Franz Bauer, Gordon Garmire, Mark Bautz, Aaron Steffen, Yuxuan Yang, Richard Mushotzky, Mauro Giavilisco, Mark Dickinson, Dan Stern, S. Okamura, C. Kretchmer, S. Miyazaki 6 Well studied fields: HDF, SSA22, Lockman Hole NW, SSA13, SSA17, A370 Deep X-ray, radio and submillimeter data for most of these Muliticolor imaging With Suprime on Subaru Megaprime on CFHT, ULBCAM on 2.2m Spectroscopy with Deimos on Keck II
HDF B,R,Z SUPRIME 15/ X 15/ Capak et al. 2004
HST F814W vs SUPRIME 8150 narrow band HST‘wide-I’ continuum NB816 narrowband Wide-field narrowband exposures comparable in depth to Hubble Deep Field continuum
1% Night Sky Filter profile Keck LRIS spectrum
z=6.56 Galaxy Behind A370 NARROW BAND (strong Ly a emission) R BAND (no galaxy detected)
Continuum break Red stars O II O III HDF SSA22 Equivalent width N(8150) < 24 samples -- Z=5.7 selection
Composite of Deimos Spectra Hu et al. (2004) R=2700 spectra allow us to easily distinguish OII and OIII emitters instrument profile
Spectroscopic z = 5.7 (solid boxes) SSA22 field to N(AB)=25.1 19 spectroscopic Lya emitters
62 objects 14 objects Redshift distribution of spectroscopically identified objects in Hawaii fields.
Ly Luminosity Function at z=3.4 & z=5.7 z=3.4 Lya LF Z=5.7 Lya LF z=3.4 Lya Sample(Cowie & Hu 1998) (Approx1 solar mass per year: no extinction case B)
Incompleteness corrected Z = 5.7 Steidel et al,z = 3 z = 4 Raw Ly a selected UV continuum luminosity function of Ly-selected objects
Z=3.4 Ly a LF Z=6.5 Ly a LF Z=5.7 Ly a LF (Approx 1 solar mass per year: no extinction case B) Lyman alpha luminosity function with z=6.5 points
Z= 5.7 Ly a emitters in SSA 22 & HDF SSA 22 (no spectroscopy) HDF SUPRIME fields Hu et al. 2004
Z= 5.7 Ly a emitters in SSA 22 & HDF SSA 22 HDF Colored symbols show selected redshift regions (about 1/4 of filter bandpass)
A 370 HDF A370 and the Subaru Deep field (Taniguchi et al. 2004) are rich compared to the HDF and SSA22 (Hu et al.2004). Z= 6.5 Ly a emitters in HDF & A 370 (Hu et al. 2005) Cosmic Variance is a Problem for High-z Studies
Instrument resolution EW(5.7)=56Å EW(6.5)=50Å FWHM(5.7) =1.1Å FWHM(6.5)= 0.8Å Composite line profiles at 5.7 and 6.5 (Virtually identical!)
Does this mean conditions are the same in the IGM at 5.7 and 6.5? • Maybe not:: (Madau, Haiman, Loeb, Gnedin, etc….) More luminous objects may self shield themselves by ionizing the gas around them. Even for lower luminosity objects: Clustered or neighboring objects may also ionize the region around the object. Preferred (low density) lines of sight may be ionized and we may have strong selection bias in our object sample.
H II region Neutral IGM Intrinsic profile Damping wing IGM scattering Small residual from red wing Final profile Can we see such an emitter prior to reionization? Maybe --- if the galaxy is bright enough (Haiman 2002, Madau 2002) Galaxy
Input profileGaussian (200 km/s) truncated by IGM scattering Stacked profile Of 19 Ly a emitters in SSA22
HST (ACS) 6000, 8000 and9000 Å images of the z=5.7Ly emitters in the GOODS-N field F606W, F775W, F850LP: only 2 of 6 are resolved by ACS 12”
Comparison of stacked colors ofz=5.7 emitters with z=5.7 quasar SED of Galaxies consistent with Ly Forest Absorption in Quasar Spectrum
Summary--- Large samples of z=5.7 and 6.5 objects can now be obtained. Ly a and continuum luminosity functions at z = 5.7 seem similar to those at lower redshifts --- (galaxies are the dominant ionizers rather than AGN) Ly a luminosity function and Ly a line shape are similar at z=6.6 and z =5.7 We may be able to make 3 dimensional maps of the cosmic web at these redshifts!
Composite line profiles of z=6.5 emitters compared with SDSS 1148+5251
Summary--- (ctd.) H reionization at z~6.2 ? Probably not….. Dark gaps may be a genuine Gunn-Peterson effect but could be just line blanketing of the increasing neutral hydrogen density Presence of residual flux in 1148 is strong evidence against the GP interpretation. Widths of lines would change… A370 z=6.5 emitter probably only consistent if it lies in a highly ionized hole produced by a neighbor object of by clusters of fainter objects.
Deimos Spectrum Hu et al. 2003 Pre scattering spectrum (schematic). Sharp edge
SHARP EDGE No sharp cutoff Spatially resolved about 4 independent positions
Emission Line window GOODS-S continuum objects from Stanway, Bunker et al GOODS-N from Spinrad et al, Weyman et al., Barger et al
Stacked z~5.7 Galaxy Properties • Compare the composite colors of the high-z Lyagalaxies with the spectra of bright quasars at the same redshift
Lya [OII] [OIII] Color-color plot: Lya Galaxies can be distinguished from [OIII] and [OII] emitters and red objects
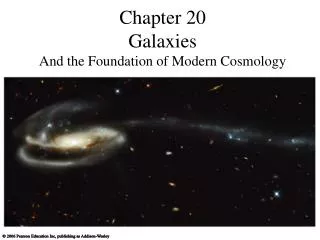
The first stars and galaxies formin the densest regions: Yellow colors show the forming stars
Searching for these first galaxies • How do we find these small distant galaxies? • Can we do it from the ground or must we wait for the James Webb space telescope (the successor to Hubble)
YES! • We can do it from Mauna Kea with its wonderful large telescopes….
The Japanese Subaru (Pleiades) Telescopeon Mauna Kea in Hawaii The largest telescope in the world with a wide-field prime-focus imaging camera • Collecting area (8.3 m diameter) • Field of view (0.5 deg on a side)
Optical Image: 50,000 galaxies in 600 square arcminutes
And much larger than the images from HST The Hubble deep field is a small part of this Subaru image which lies just above the big dipper on the sky.
Subaru can reach the depth ofHST though not quite the resolution • HST gives sharper images which allow us to see more of the structure of the galaxies.
How do we find the small early galaxies amid this sea of objects? Most of what we see in this optical image is relatively nearby. There are only a small number of very distant galaxies in the image.
Here is what a similar areaof the sky might look like at a time when the universe was a tenth it present age based on simulations. The little yellow patches show the galaxies.