Download

1 / 9
90 likes | 300 Vues
Systolic Blood Pressure in Relation to Body Mass Index. Posed Hypothesis. Is there a correlation between an adult’s body mass index (BMI) and their systolic blood pressure…. Collected Data.

E N D
Posed Hypothesis • Is there a correlation between an adult’s body mass index (BMI) and their systolic blood pressure…
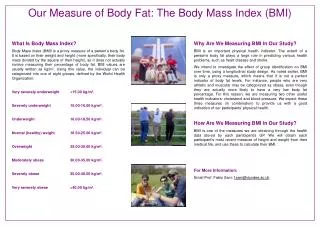
Collected Data Data for this hypothesis was gathered using simple random sampling at each group member’s place of employment. Each person was assigned a number and then five unique numbers were randomly selected. The people corresponding to the numbers were assessed in terms of their height, weight, and blood pressure.
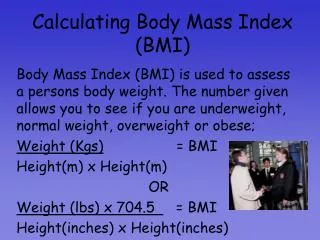
Statistics Summary Statistics Summary for BMI Mean: 25.337 Standard Deviation: 5.147 Range: 18.5 Mode: 21.6 Five-Number Summary: 18, 21.6,23.8, 30, 36.5 Outliers; None Statistics Summary for SBP Mean: 123.067 Standard Deviation: 16.465 Range: 79 Mode: 110 Five-Number Summary: 99, 110,121, 132, 178 Outliers: 178
Correlation between SBP and BMI Sample Size: n=30 Correlation Coefficient (R): 0.4399 Standard Deviation: 14.0275 Y Intercept: 87.4095 Slope: 1.4073 P-Value: P<0.015 Critical Value: 0.361 Equation for line of regression: y = 1.4073x + 87.4095
What do these values mean? • The linear correlation coefficient proves there is not a strong linear relation between the two variables. • The correlation coefficient is greater than the critical value which proves there is a positive correlation between the two variables. • The p value is less than the level of significance which means the null hypothesis should be rejected.
Conclusion In conclusion, the hypothesis “Is there a correlation between systolic blood pressure and body mass index” should be rejected. There is not a correlation or linear relation between the two variables.
ContributionsGroup 2 • Pamela Perry: data collection, overall PowerPoint Presentation layout and data, graphs for PowerPoint • Alex Williams: data collection, graphs for PowerPoint • Alisa Garcia: data collection • Heather Holt: data collection, submission of topic selection and data results for the group • Mercedes Sanders: data collection • Angel Shafizadeh: data collection, graphs for PowerPoint Each member of the group collected data and reviewed the PowerPoint to give suggestions and final approval.