Download
1 / 24
240 likes | 340 Vues
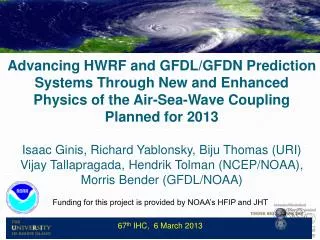
Progress in Developing Coupled Tropical Cyclone-Wave-Ocean Models for Operational Implementations at NOAA and Navy Isaac Ginis Morris Bender, Tetsu Hara, Richard Yablonsky, Biju Thomas, Yalin Fan, Jian-Wen Bao, Chris Fairall, Laura Bianco University of Rhode Island, NOAA/GFDL, NOAA/ESRL.

E N D
Progress in Developing Coupled Tropical Cyclone-Wave-Ocean Models for Operational Implementations at NOAA and NavyIsaac GinisMorris Bender, Tetsu Hara, Richard Yablonsky, Biju Thomas, Yalin Fan, Jian-Wen Bao, Chris Fairall, Laura BiancoUniversity of Rhode Island, NOAA/GFDL, NOAA/ESRL Interdepartmental Hurricane Conference, Savannah, GA March 1-4, 2010
Operational Coupled Tropical Cyclone-Ocean Models • 2001 – GFDL/POM at NCEP in Atlantic ocean (3D coupling). • 2004 – GFDL/POM at NCEP in Eastern and Central Pacific (1 D coupling). • 2007 – HWRF/POM at NCEP in Atlantic ocean (3D coupling). • 2008 – GFDN/POM at FNMOC in Atlantic ocean (3D coupling) and all other oceans(1D coupling) • 2009 – GFDN/POM at FNMOC in the Northern Pacific ocean (3D coupling).
Conventional Coupling Between Tropical Cyclone and Ocean Models Atmospheric Model Momentum flux (τ) Sensible heat flux (QH) Latent heat flux (QE) Momentum flux (τ) Wind speed (Ua) Temperature (Ta) Humidity (qa) Surface current (Us) SST (Ts) Air-Sea Interface Ocean Model
Atmospheric Boundary Layer Wave Boundary (Surface) Layer Momentum & KE Flux Heat & Humidity Flux Turbulence Sea Sprays Air-Sea Interface Wave induced stress Reynolds stress Airflow separation Intermittency Nonbreaking Waves Breaking Waves Stokes drift Momentum & KE Flux Bubbles Intermittency of Momentum & KE injection (Langmuir) Turbulence Gas Flux Ocean Boundary Layer
New Coupled Tropical Cyclone-Ocean Framework (being implemented into HWRF and GFDN models) • TC model: air-sea heat and momentum fluxes and sea spray source functions • explicitly include SST,sea-state dependence and ocean current effects. • Wave model: is forced by sea-state dependent momentum flux and includes • ocean current effects. • Ocean model: is forced bysea-state dependent momentumfluxes.
Effect of Wind-Wave-Current Interaction on Hurricane-Generated Waves Hurricane Ivan (2004) Envisat-1 ERS - 2 Fan, Ginis, Hara & Walsh J. Phys. Oceanogr. (2009)
Impact of Loop Current and Warm Core Eddy on Hurricane-Generated Surface Waves Satellite altimetry Sept.12 Model Temp 70 m Sept. 12 2:40 UTC Sept. 15 21 UTC Sept. 14
Impact of Loop Current and Warm Core Eddy on Hurricane-Generated Surface Waves WW3 significant wave height difference with and without LC/WCE (m) (m) WCE 21:00 UTC Sept.14 2:40 UTC Sept. 15 LC Significant wave height (Hs) along flight track LC WCE
Impact of Loop Current and Warm Core Eddy on Hurricane-Generated Surface Waves 21:00 UTC Sept.14 2:40 UTC Sept.15 Ocean current difference with and without LC/WCE Dominant wave direction Significant wave height
Navy’s Operational GFDN Model • GFDN is run at FNMOC of NOGAPS global model. Ocean model is initialized from Navy’s NCODA analysis • Model physics changes implemented in GFDN in 2008 compared to NOAA’s GFDL model: - Penetrative solar radiation included in ocean model • Bug fixed in Ch calculations and coupling interpolation
Development of High-Resolution GFDN • Atmospheric grid resolutions • Princeton Ocean Model grid resolutions Operational GFDN: Mesh 1: 75ox75o – 1/2o res Mesh 2: 11ox11o – 1/6o res Mesh 3: 5ox5o – 1/12o res High-Resolution GFDN Mesh 1: 75ox75o – 1/2o res Mesh 2: 11ox11o – 1/6o res Mesh 3: 5ox5o – 1/18o res High-Resolution GFDN: 1/12o Operational GFDN: 1/6o
Wind Speed Cross-Section (72h) Katrina: August 25th, 0z forecastImproved Structure with Higher Resolution 1/12th Degree Resolution 1/18th Degree Resolution
Surface Winds (72 hr)Katrina: August 25th, 0z forecastImproved Structure with Higher Resolution 1/12th Degree Resolution 1/18th Degree Resolution
Accumulated precipitation (47-48 hr)Katrina: August 25th, 0z forecastImproved Structure with Higher Resolution 1/18th Degree Resolution 1/12th Degree Resolution
Effect of Global Model on GFDN Forecasts in Western Pacific • 266 forecasts in 2009 were rerun in the Western Pacific using the GFS global model for initial and boundary conditions. • No changes were made in the ocean model initialization.
Average Track Errors 48 hr 72 hr 96 hr NORMALIZED ERRORS RELATVIE TO CLIPPER
Track Errors for Each Storm 72 HOUR GFDN from NOGAPS (black) GFDN from GFS (red)
1 GFDN 2 NOGAPS 3 GFS 4 GFDN FROM GFS 30 N 20 N Typhoon Nida (25W) 20N Nov. 25th, 12z Nov. 24th, 18z 10N 140E 150E 130E 140E Nov. 26th, 00z Nov. 26th, 12z 30 N 1 GFDN 2 NOGAPS 3 GFS 4 GFDN FROM GFS 1 GFDN 2 NOGAPS 3 GFS 4 GFDN FROM GFS 1 GFDN 2 NOGAPS 3 GFS 4 GFDN FROM GFS 20 N 20 N
Average Intensity Error NORMALIZED ERRORS RELATIVE TO ST5D
Intensity Errors for Each Storm 72 HOUR GFDN from NOGAPS (black) GFDN from GFS (red)
Conclusions • Increased horizontal resolution in GFDN model improves horizontal and vertical structures in simulated tropical cyclones. Initial test results suggest that some model physics may need to be retuned for better performance. • Experimental GFDN runs using GFS global model in the Western Pacific show improved forecasts skill for both track and intensity compared to the operational GFDN model • Coupling with the WAVEWATCH wave model and introducing sea spray effects is in progress.
Track Errors in GFDN and GFS for Each Storm 72 HOUR TRACK ERROR GFS (black) GFDN from GFS (red) 120 HOUR TRACK ERROR
Typhoon CHOI-WAN (15W) 1 GFDN 2 NOGAPS 3 GFS 4 GFDN FROM GFS 20 N 20 N Sep. 12th, 18z Sep. 12th, 12z 140 E 150 E 140 E 150 E 1 GFDN 2 NOGAPS 3 GFS 4 GFDN FROM GFS 30 N 1 GFDN 2 NOGAPS 3 GFS 4 GFDN FROM GFS 20 N 20 N Sep. 13th, 6z Sep. 13th, 18z 140 E 150 E 140 E 150 E