Download
1 / 20
200 likes | 351 Vues
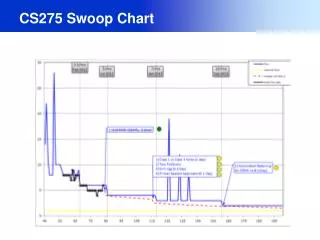
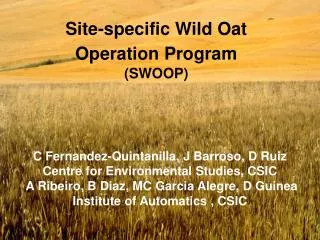
Site-specific Wild Oat Operation Program (SWOOP). C Fernandez-Quintanilla, J Barroso, D Ruiz Centre for Environmental Studies, CSIC A Ribeiro, B Diaz, MC Garcia Alegre, D Guinea Institute of Automatics , CSIC. 1. Associations among site properties and abundance of wild oats. Soil types.

E N D
Site-specific Wild Oat Operation Program (SWOOP) C Fernandez-Quintanilla, J Barroso, D Ruiz Centre for Environmental Studies, CSIC A Ribeiro, B Diaz, MC Garcia Alegre, D Guinea Institute of Automatics , CSIC
1. Associations among site properties and abundance ofwild oats
Soil types Wild oat density 2 3 1
Economic comparison (C/ha)between the three assessment methods MethodContacts Visual/walk Visual/combine Sampling cost 36 36 9 Herbicide cost 33 25 18 Fixed costs 289 289 289 Yield benefit 390 387 382 NET RETURN 32 37 66
Infestation map Infestation level 0 (<0,1 panícules/m2) 1 (0,1-1 panícules/m2) 2 (1-10 panícules/m2) 3 (> 10 panícules/m2)
Treatment map Treatments: % of area: None 28 Assert 0.6 l/ha 43 Assert 1.25 l/ha 22 Assert 2.5 l/ha 7
From season to season Relationship between: - panicle density (at harvest time) and - seedling density (at treatment time, next year) Abundance Presence R2 = 0,59
Among various seasons N 1999 2000 2001 2002 STABILITY IN LOCATION
STABILITY IN LOCATION Test for stability of spatial distribution (Syrjala, 1996)
STABILITY IN DENSITY Seedlings/m2 2002 1999 2000 2001
STABILITY IN DENSITY 4 y= -1,0424x + 2086 2 R = 0,81 3 y = -0,9756x + 1951,9 2 log seedlings/m2 2 R = 0,69 1 y = -0,587x + 1174,5 0 2 R = 0,61 1997 1998 1999 2000 2001 Years