Download
1 / 22
220 likes | 323 Vues
ITF Transport Outlook Meeting the needs of 9 billion people. Plenary 2: Towards a Green Economy ITF Transport Outlook. Transforming Transportation Washington DC 26 January 2012. Transforming Transportation Plenary 2: Towards a Green Economy Washington DC 26 January 2012.

E N D
ITF Transport Outlook Meeting the needs of 9 billion people Plenary 2:Towards a Green Economy ITF Transport Outlook Transforming Transportation Washington DC 26 January 2012 Transforming Transportation Plenary 2: Towards a Green Economy Washington DC 26 January 2012
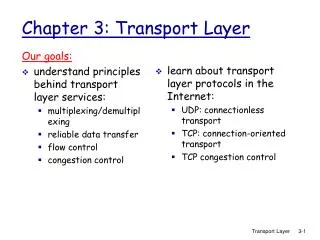
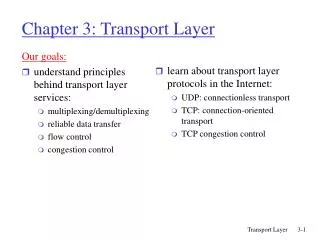
Global passenger transport activity 2000 – 2050 Index of pkm (2000 = 100) High: European saturation levels in BRICs Low: Japanese saturation levels in BRICs Source: International Transport Forum calculations using IEA MoMo version 2011.
Global passenger transport activity 2000-2050 • Meeting the needs of 9 billion people • Outlook fraught with uncertainty over such a long period • Global passenger-km increase 3-4 times by 2050 • Outside OECD pkm could increse 5 or 6 fold • Range is not measure of uncertainty but illustrates potential impact of modest changes in assumptions • Low scenario – IEA base case in WEO 2008, Emerging economies reach Japanese levels of car ownership and use levels • High scenario: European saturation levels • Share of car trips seems set to rise from <10% in China to >50%
Aviation • Medium term in line with IEA and IATA • Longer term: • Low scenario lower than IATA especially in OECD countries • High OECD continues to grow non-OECD accelerates with deregulation and open skies • High is still much lower than aircraft makers forecasts
Global freight transport activity, 2000 - 2050 Index of tkm (2000 = 100) High: Constant freight intensity Low: Dematerialisation of growth Source: International Transport Forum calculations using IEA MoMo version 2011.
Freight Transport Activity 2000-2050 • Global freight tonne-km to rise 2.5 – 3.5 times by 2050 • Low scenario: Dematerialisation of growth, eg shift to services • High scenario: GDP growth continues at 2005 freight intensity levels • Developing countries may be embarking on a relatively freight intensive growth path, so full upside risk not reflected in graph
High Scenarios • Best interpreted as where demand would like to go • Realistic? Policy intervention? • Eg fast urbanisation might slow growth of car ownership and use • High energy prices would suppress • But high scenarios far from impossible
Impact of Economic CrisisUSA External trade by sea and air, percentage change from pre-crisis peak Jun-08 (Tonnes, monthly trend, seasonally adjusted) Jun-11 Sep-11 Jun-11 Sep-11 Source: ITF Trade and Transport Database
Impact of Economic Crisis • Total trade by sea and air in US • 2 years to recover, but now flatlining or falling again • End of stimulus, cooling of Chinese growth, in Europe bite of austerity • Outlook incorporated 5 year shift • Next will look at longer stagnation
EU External trade by sea and air, percentage change from pre-crisis peak (Tonnes, monthly trend, seasonally adjusted) Source: ITF Trade and Transport Database
Shift in centre of gravity from OECD to non-OECD countries (halfway case between high and low scenarios) Source: International Transport Forum calculations using IEA MoMo version 2011.
Global CO2 emissions from transport index (2000 = 100) High: European car saturation levels in BRICs air liberalisation Low: Japanese saturation levels in BRICs and dematerialisation Source: International Transport Forum calculations using IEA MoMo version 2011.
Global CO2 emissions from transport • CO2 emissions rise less quickly than mobility through fuel economy improvement • Increase 2.5 to 3 times
Car Fuel Economy/CO2 Targets Source: March 2011
Global CO2 emissions from transport • Maximisation of cost effective fuel economy improvement around the world, eg through continues progress with emissions standards would stabilise emissions • GFEI target • 8 l/100km ave new fleet economy in 2008 rise to 4 l/100km in 2030; whole fleet 2005 • Impressive but not enough to for IPCC 450ppm CO2 limit
Average LDV on-road fuel-intensity,baseline and stabilization of emissions(litres gasoline equivalent per 100km) Source: International Transport Forum calculations using IEA MoMo version 2011.
Peak Travel?Passenger-kilometres by private car and light trucks, 1970 – 2009 index (1990 = 100) Source: ITF 2011 Transport Outlook from Household Survey Data
Peak travel? • Evidence of reduced responsiveness of car and light truck travel to increasing incomes in advanced economies • As the effect of income on travel (vkm) diminishes, it leaves a larger role to other determinants such as fuel prices, urbanisation, ageing and network management • But economic cycle visible in US in particular • And income distribution may have a large role. Income growth in last decade concentrated on wealthiest 10%. Incomes decreased in many of the lower deciles.
Peak travel? • High income households are less responsive due to saturation, low income households very responsive • Whether or not growing income translates into more driving (VMT) thus also depends on the distribution of income growth • Uncertainty over future income likely to play a role in medium term • Demographics becoming increasingly important • These factors have strong implications for the projection of long run transport demand
Passenger Modal Split, 2005 and 2050 halfway case between high and low scenario, p-km (%) OECD Non-OECD Source: International Transport Forum calculations using IEA MoMo version 2011.
Freight modal split by region, 2005 and 2050halfway case between high and low scenarios, t-km (%) OECD Non-OECD Source: International Transport Forum calculations using MoMo version 2011.
Thank you Stephen PerkinsT +33 (0)1 45 24 94 96E stephen.perkins@oecd.org Postal address 2 rue Andre Pascal75775 Paris Cedex 16