Download
1 / 2
20 likes | 111 Vues
Surface residue reduces erosion, while reduced tillage methods result in less erosion. Corn returns more residue than soybeans, leading to decreased soil loss. Roller-crimper creates a weed-suppressing cover crop mat for planting.

E N D
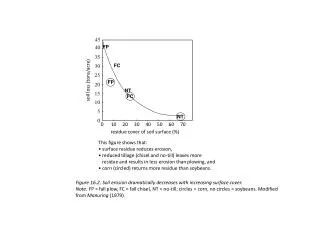
FP 45 40 FC 35 soil loss (tons/acre) FP 30 NT 25 FC 20 15 NT 10 0 10 20 30 40 50 60 70 5 residue cover of soil surface (%) 0 This figure shows that: • surface residue reduces erosion, • reduced tillage (chisel and no-till) leaves more residue and results in less erosion than plowing, and • corn (circled) returns more residue than soybeans. Figure 16.2. Soil erosion dramatically decreases with increasing surface cover. Note: FP = fall plow, FC = fall chisel, NT = no-till; circles = corn, no circles = soybeans. Modified from Manuring (1979).
Figure 16.7. Roller-crimper creates a weed-suppressing cover-crop mat through which it is possible to plant seeds or transplants. Here cotton is being planted behind rye that has been traveled over by the roller-crimper. Photo by Jeff Mitchell.