Download
1 / 20
350 likes | 830 Vues
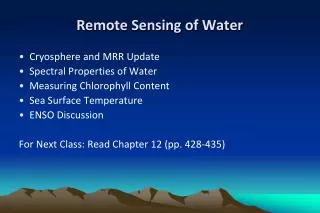
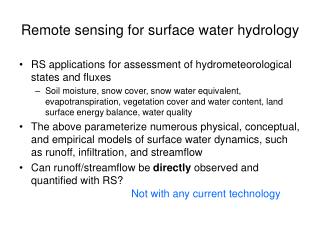
Remote sensing for surface water hydrology. RS applications for assessment of hydrometeorological states and fluxes Soil moisture, snow cover, snow water equivalent, evapotranspiration, vegetation cover and water content, land surface energy balance, water quality

E N D
Remote sensing for surface water hydrology • RS applications for assessment of hydrometeorological states and fluxes • Soil moisture, snow cover, snow water equivalent, evapotranspiration, vegetation cover and water content, land surface energy balance, water quality • The above parameterize numerous physical, conceptual, and empirical models of surface water dynamics, such as runoff, infiltration, and streamflow • Can runoff/streamflow be directly observed and quantified with RS? Not with any current technology
} = CurveNumber NRCS* Curve number method • Data and Parameters • Digital Elevation model • Watershed delineation • Land use / land cover • Soil hydrologic group • Precipitation data • Streamflow record • Stream baseflow estimation • Antecedent moisture condition * NRCS – Natural Resources Conservation Service
RS direct quantification Soil moisture RS proxy characterization Passive microwave methods Landscape state and energy flux Infiltration Essential observations of a surface water system Precipitation (rainfall) Runoff Streamflow Infiltration very coarse spatial resolution poor temporal resolution expensive data moderate spatial resolution excellent temporal resolution free data
Data and Methodology • Remote Sensing Data MODIS NASA’s Moderate Resolution Imaging Spectroradiometer • Surface temperature (LST) • Albedo • Vegetation state • NDVI (Normalized Difference Vegetation Index) • EVI (Enhanced Vegetation Index) • User derived MSI (Moisture Stress Index) and others AMSR-EAdvanced Microwave Scanning Radiometer • Soil Moisture (resolution issues?) • Vegetation water content and roughness
http://malibusurfsidenews.com/blog/uploaded_images/ USGS_Pic2488r-764415.jpg General methodology Model parameterization based on: • MODIS time-series landscape biophysicals • High temporal resolution (daily but composited as 8 and 16 day products) • Moderate spatial resolution (0.25 - 1km2 pixel dim) • NEXRAD radar (Stage III, MPE) precipitation estimates • USGS gauged streamflow records
NEXRAD MPE radar estimate of hourly precipitation rate for 4 July 2006 (21:00 GMT) for Sandies Creek watershed and surrounding region. Rates ranged from 0.0 mm/hr (black pixel) to 14.6 mm/hr (white pixel) for cells within the watershed
Daytime LST (8 day composite) for the Sandies Creek watershed for the period 18 - 25 February 2002. Mean temperatures for this period ranged from 24.9 C (dark pixels) to 29.3 C (light pixels).
NDVI (16 day composite) image of the Sandies Creek watershed for the period 18 February – 6 March 2002. Dark-toned and light-toned pixels represent low and high NDVI values (stressed vegetation vs healthy), respectively.
How is LST coupled to soil moisture (or vice versa) • Heat flux from the earth’s surface • Radiative flux (long wave thermal 9-13 μm) • Sensible heat flux (convection and conduction) • Latent heat flux (phase change) • Is soil surface emissivity affected by soil moisture? would this affect radiative, sensible, or latent heat loss? • Would a loss or gain of near-surface soil moisture likely impact sensible or latent heat flux?
From: http://upload.wikimedia.org/wikipedia/en/6/69/LWRadiationBudget.gif
visible near infrared middle infrared Leaf water content Leaf structure Leaf chemistry Coupling vegetation to soil moisture
red nir
Band 6 Band 7 Band 2
Development of a benchmark model (CN) for Sandies Creek for 2004
Final equation: where Q = streamflow, P = precipitation, T = LST, and I = EVI All β1,2,3 estimates significant at P < 0.0001 β0 estimate significant at P < 0.04 RS Model Development (2004) • 6 MODIS parameters (LSTday, LSTnight, NDVI, EVI, NDWI, MSI) x 2 states (raw, deseasoned) x 3 antecedent offsets (0, 8, 16 days) = 36 regressors evaluated (plus precipitation) • Streamflow log transformed (normality assumptions) • Final model: Prec, LSTdayr(1), EVIr(0)
Sandies Creek calibration and validation results * Exclusion of July 2002 flood event Validation Calibration