Surface Water Applied Hydrology
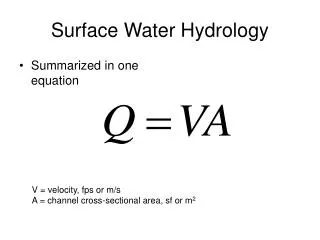
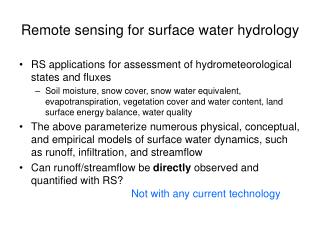
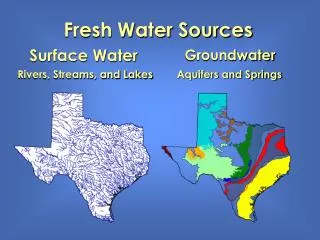
Surface Water Applied Hydrology. Surface Water. Source of Streamflow Streamflow Characteristics Travel Time and Stream Networks. Surface Water. Surface water is water stored/flowing on the earth surface.


Surface Water Applied Hydrology
E N D
Presentation Transcript
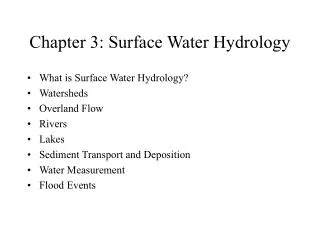
Surface Water • Source of Streamflow • Streamflow Characteristics • Travel Time and Stream Networks
Surface Water • Surface water is water stored/flowing on the earth surface. • The surface water system continually interacts with the atmospheric and subsurface systems.
Sources of Streamflow The watershed is the area of land draining into a stream at a given location. The various surface water processes vary through time during a storm. Precipitation contributes to various storage and flow processes as shown in the figure. Rate relative to precipitation rate Time since precipitation began The disposal of precipitation during a storm on a watershed.
Sources of Streamflow Initially, a large proportion of the precipitation contributes to surface storage; as water infiltrates into the soil, there is also soil moisture storage. • There is 2 types of storage; • Retention : is storage held for long period of time and depleted by evaporation. • Detention: is short-term storage depleted by flow away from the storage location.
Sources of Streamflow • As the detention storages begin filling, flow away from them occurs • unsaturated flow through the unsaturated soil near the land surface. • groundwater flow through saturated aquifers deeper down. • overland flow across the land surface.
Sources of Streamflow Channel flow is the main form of surface water flow. All the other surface flow processes contribute to it. Determining flow rates in stream channels is a central task of surface water hydrology. The precipitation which becomes streamflow may reach the stream by overland flow, subsurface flow, or both.
Sources of Streamflow Hortonian Overland Flow Horton (1933) described overland flow as follows: Neglecting interception by vegetation, surface runoff is that part of rainfall which is not absorbed by the soil by infiltration. If the soil has an infiltration capacity, f, expressed in inches depth absorbed per hour, then when the rain intensity i is less than f, the rain is all absorbed and there is no surface runoff. I < f No Surface runoff
Sources of Streamflow Hortonian Overland Flow I > f Surface runoff = (i-f) = Rainfall Excess If i is greater than f, surface runoff will occur at the rate (i-f). Horton termed this difference (i-f) “Rainfall Excess” Horton considered surface runoff to take the form of a sheet flow whose depth might be measured in fractions of an inch. As flow accumulates going down a slope, its depth increases until discharge into a stream channel occurs. Along with overland flow there is depression storage in surface hollows and surface detention storage proportional to the depth of the overland flow itself. The soil stores infiltrated water and then slowly releases it as subsurface flow to enter the stream as baseflow during rainless periods.
Sources of Streamflow Hortonian Overland Flow Hortonian overland flow is applicable for impervious surfaces in urban areas, and for natural surfaces with thin soil layers and low infiltration capacity as in semiarid and arid lands. Hortonian overland flow occurs rarely on vegetated surfaces in humid regions. Under these conditions, the infiltration capacity of the soil exceeds observed rainfall intensities for all except the most extreme rainfalls. Subsurface flow then becomes a primary mechanism for transporting stormwater to streams.
Stream Flow Flow Characteristics of a Stream • The flow characteristics of a stream depend upon • the intensity and duration of rainfall • shape, soil, vegetation, slope, and drainage network of • the catchment basin • climatic factors influencing evapotranspiration
Stream Flow Flow Characteristics of a Stream Perennial Stream Which have some flow at all times of a year due to considerable amount of base flow into the stream during dry periods of the year. The stream bed is lower than the ground water table.
Stream Flow Flow Characteristics of a Stream Intermittent Stream Have limited contribution from the ground water. During the wet season when the ground water table is above the stream bed, there is a base flow contributing to the stream flow. Streams remain dry for most of the dry season periods of a year.
Stream Flow Flow Characteristics of a Stream Ephemeral Stream Do not have any contribution from the base flow. The annual hydrograph of such a stream show series of short duration hydrographs indicating flash flows in response to the storm and the stream turning dry soon after the end of the storm. Such streams generally found in arid zones, do not have well defined channel.
Stream Flow Flow Characteristics of a Stream • Stream are also classified as • Effluent: streams receiving water from ground • water storage. Perennial Stream • Influent: streams contributing water to the • ground water storage. Intermittent StreamEphemeral Stream
Stream Flow Graphical Representation of Stream Flow Flow Mass Curve/Runoff Mass Curve/ Inflow Mass Curve Flow Mass Curve is cumulative flow volume, V versus time curve.
Stream Flow Graphical Representation of Stream Flow Flow Mass Curve/Runoff Mass Curve/ Inflow Mass Curve The mass curve ordinate, V at any time t is given as to = the time at the beginning of the curve. The slope of the mass curve at any point on the plot, dV/dt equals the rate of streamflow at that time. Mass curve is always rising curve or horizontal curve and is useful means by which one can calculate storage capacity of a reservoir to meet specified demand as well as safe yield of a reservoir of given capacity.
Example 1 Flow Mass Curve The following table gives the mean monthly flows of a stream during a leap year. Determine the minimum storage required to satisfy a demand rate of 50 cms.
Example 1_Solution Flow Mass Curve Mass Flow Curve and Demand Line Mass curve of the accumulated flow versus time is shown in the figure. For the mass curve and demand rate, all months are assumed to be of equal duration, 30.5 days. A demand line with a slope of line PR is drawn tangential to the mass flow curve at A. Another line parallel to this line is drawn so that it is tangential to the mass flow curve at B. The vertical difference BC = 2,850 cumec-day is the required storage for satisfying the demand rate of 50 cms.
Streamflow Graphical Representation of Stream Flow Flow-Duration Curve/Discharge-Frequency Curve • Flow-Duration Curve of a stream is graphical plot of stream discharge against the corresponding percent of time that the stream discharge was equalled or exceeded. The flow-duration curve describes the variability of the streamflow and is useful for • determining dependable flow which information is required for • planning of water resources and hydropower projects. • designing a drainage system. • flood control studies.
Streamflow Flow-Duration Curve • Preparing a flow-duration curve • the streamflow data is arranged in a descending order of stream • discharges. If the number of such discharges is very large, one can • use range of values as class intervals. • Percentage probability, Pp of any flow magnitude, Q being • equalled or exceeded is given as • m = the order number of the discharge (or class interval) • N = the number of data points in the list
Streamflow Flow-Duration Curve • The discharge Q is plotted against Pp to yield flow-duration curve. The ordinate, Q at any percentage probability, Pp represents the flow magnitude in an average year that can be expected to be equalled or exceeded Pp percent of time and is termed as “Pp% Dependable Discharge”. Discharge (cms) Pp (%)
Example 2 Flow-Duration Curve The observed mean monthly flows of a stream for a water year (June 01-May 31) are as given in the first two columns of the following table. Plot the flow-duration curve and estimate the flow that can be expected 75% of the time in a year and also the dependability of the flow of magnitude 30 cms.
Example2_Solution Flow-Duration Curve Q75 =15.5 cms Dependability of the flow of magnitude 30 cms =31.5% FDC Discharge (cms) Pp (%)
Example 3 Flow-Duration Curve Column 1 of the table below gives the class interval of daily mean discharges of a streamflow data. Column 2, 3, 4, and 5 give the number of days for which the flow in the stream belonged to that class in 4 consecutive years. Estimate 80% dependable flow for the stream.
Discharge (cms) Pp (%) Example3_Solution Flow-Duration Curve Q80 =37 cms
Example4 Flow-Duration Curve Flow-Duration Curve calculation in spreadsheet