Download

1 / 30
640 likes | 1.74k Vues
Surface Water Hydrology: Infiltration – Green and Ampt Method. Nick Fang, Ph.D., P.E. 2013. http://techalive.mtu.edu/meec/module01/Thehydrologiccycle.htm. Runoff Generated from a Watershed. DEM Watershed Precipitation Infiltration Runoff Tributary Stream flow.

E N D
Surface Water Hydrology: Infiltration – Green and Ampt Method Nick Fang, Ph.D., P.E. 2013
http://techalive.mtu.edu/meec/module01/Thehydrologiccycle.htmhttp://techalive.mtu.edu/meec/module01/Thehydrologiccycle.htm
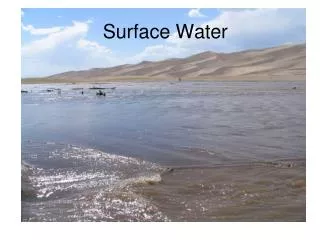
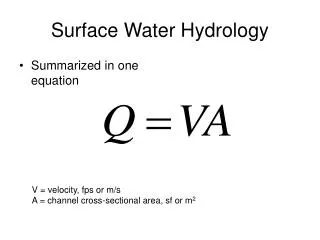
Runoff Generated from a Watershed • DEM • Watershed • Precipitation • Infiltration • Runoff • Tributary • Stream flow
Introduction • Infiltration is a key component to hydrological process. • Mathematical Methods have been developed for computing and simulating infiltration: Green-Ampt Model (1911) Philip’s method for Richards equation (1957) Finite difference method for Richards equation • Computer Models have been developed to simulate the infiltration procedure. HEC-HMS (Green-Ampt) MIKE-SHE and HYDRUS (Richards, Finite difference method) • Important factors: Rainfall Intensity Soil Properties
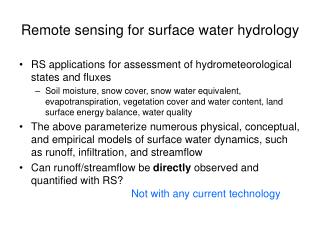
Some of the precipitation that falls on land seeps into the ground where it is stored in aquifer and is transported to streams and lakes by subsurface flow. • The amount of infiltration is influenced by the permeability and moisture content of the soil, the presence of vegetation and the volume and intensity of precipitation. • Large particles have large spaces between them and let more water in and large rain events can lead to more infiltration on the amount of water stored in the aquifer.
Infiltration Process • The process of rain water entry into the soil. • Early: capillary force dominates. • Later stage: gravitational force dominates = infiltration rate = Ks. • Ponding = Infiltration rate decreases with time (rainfall duration).
Let us consider a simple system • Homogenous soil • 1-D vertical system • Uniform initial conditions • Constant rainfall rate (i)
1 2 Infiltration into a Soil Water Column (Darcy’s Law) Flow Equation Mass Equation f: infiltration rate (depth/time); F: Cumulative infiltration depth (depth); K(ө): Vertical hydraulic conductivity (depth/time); z: Depth below surface (depth); h: Potential or head (depth); ө: Volumetric moisture content; L: Soil column depth (depth). Ψ: Suction Head – pull the water downward (-depth)
Green – Ampt Infiltration Method Relative saturation Incremental change in soil water content as wetting front passes
Math for Green-Ampt (1911) Infiltration Theory with time variable dependent on rainfall intensity (i) Green-Ampt model calculates cumulative infiltration by assuming water flow into a vertical soil profile like a piston flow Parameters required: K: Vertical hydraulic conductivity (depth/time); : Suction head (negative depth); by Chow et al. (1988) : Moisture content difference at two levels.
Theoretical Observations • Infiltration rate approaches Ks. • Wetting front assumes a constant shape when the infiltration rate approaches a constant value.
3 Conditional Infiltration Scenarios Case 1: i < Ks. = Runoff will never occur and all rainfall will infiltrate regardless of the duration; then f = i (curve A) . Case 2: Ks < i < f. = The time to ponding varies for different rainfall intensities; then f = i until F = its = Fs; following Equation (curve B-C) Case 3: i > f. = Runoff can occur. Ponding Time As long as i > Ks, infiltration rate (f) asymptotically approaches Ks.
i More Detailed Information for Case 1 Case 1: i < Ks
i More Detailed Information for Case 2 Case 2: Ks < i < f
Soil Classification USDA particle size classification < 0.002mm is clay 0.002 – 0.5mm is silt 0.5mm – 10mm is sand > 10mm is gravel http://www.soils.agri.umn.edu/academics/classes/soil2125/doc/s2chp1.htm
USDA Soil Texture Triangle A soil with 30% sand, 40% clay and 30% silt is a Clay Loam % Silt = 100 - %Sand - %Clay
Variation of Saturated Hydraulic Conductivity with Soil Texture K Se
Figure 1. 3-D plot of infiltration rates for sandy soil conditions. Figure 2. 3-D plot of infiltration rates for clayey soil conditions. Typical Relationships for Green- Ampt Variables in 3–D http://www.ocrwm.doe.gov/ym_repository/studies/sitechar/infiltration.shtml
Double Ring Infiltrometer Measure rate of fall in inner ring Infiltration http://www.alwi.com/wastewater.php
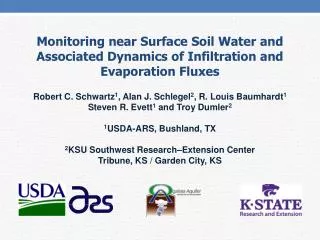
Application of KBr tracer to estimate infiltration rates at an unsaturated-zone well installation.
Example 1 This formula has been transformed from its original one in order to solve for Fs.
Confused? Or B A When Ψ is given positive, Formula A will be used. When Ψ is given negative, Formula B will be used.