Download
1 / 25
250 likes | 410 Vues
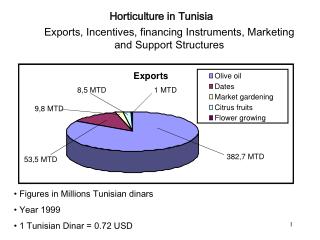
China’s Effects on Mexican Exports. Alejandro M. Werner October 2004. Index. Mexican exports recent evolution What explains the behavior of exports? Sector-level estimation Subsector-level estimation Concluding remarks.

E N D
China’s Effects on Mexican Exports Alejandro M. Werner October 2004
Index Mexican exports recent evolution What explains the behavior of exports? Sector-level estimation Subsector-level estimation Concluding remarks
The rapid expansion of Mexican exports to the US following NAFTA slowed down after 2001. Chinese exports grew fast and displaced Mexico as the second largest exporter to the US in 2002. Concerns were raised by the breakdown of the Mexico-US trade linkages. Non-oil Exports to the US (billion dollars, monthly) US Total Non-oil Imports Correlation (18-month mobile correlation coefficient)
Some observers wondered whether the recent behavior of Mexican exports were driven by: • The US recession • Increased Chinese competition in the US market • Loss of competitiveness • The last two effects nurtured the impression that the Mexico-US trade linkages may have weakened, as the recovery of Mexican exports did not follow the rebound of US demand promptly.
Index Mexican exports recent evolution What explains the behavior of exports? Sector-level estimation Subsector-level estimation Concluding remarks
To disentangle the different effects on exports of manufactures, the analysis considered 3 sectors or types of goods (SITC classification): Manufactures, Machinery and Transport Equipment, and Miscelaneous Manufactures. A series of rolling regressions were estimated for each sector. • The variables per sector were (MoM first-differences of logs): • US imports in 2002 dollars (s.a.) • Exports of China to the US in 2002 dollars (s.a.) • US-Mexico bilateral real exchange rate index • A 36-month rolling sample ending in the date reported was used. • The equation allows to identify the contribution of each variable to the growth of exports. • The error term captured the presence of other factors affecting exports.
Sector: Manufactures • Chinese exports do not have a significant negative impact on Mexican exports. • Except for some periods, the real exchange rate does not have a significant effect on exports. • There is a high positive correlation with US imports. The elasticity is stable and there is no evidence that it diminished in 2000-2004. China´s Exports ( ) Real Exchange Rate ( ) US Imports ( )
Sector: Manufactures • US imports fully explain Mexican exports’ growth for the period 1998-2000. Chinese exports had, in any case, a minor negative impact. • In 2000-2003, the fall of US imports accounted for less than half of the total change in Mexican exports and no negative effect of China was present. Accumulated Variation 1998-2000 (Million dollars of 2002) Accumulated Variation 2000-2003 (Million dollars of 2002)
Sector: Machinery and Transport Equipment • Chinese exports appear to have a negative effect on Mexican exports as the rolling sample enters 2002. This negative effect increases steadily and stabilizes by the end of the sample. • The real exchange rate had a positive impact on exports, which is statistically significant for the sample ending in early 2003. • The elasticity with respect to US imports is strong and relatively stable, but starts to diminish in late 2003. China´s Exports ( ) Real Exchange Rate ( ) US Imports ( )
Sector: Machinery and Transport Equipment • In 1998-2000, shifts in US imports accounted for most of the changes in Mexican exports growth. China and the real exchange rate played a minor role. • In 2000-2003, Chinese exports displaced a larger amount of Mexican products. However, most of the reduction is captured by the error term, which is followed by the negative impact of the fall of US imports. Accumulated Variation 1998-2000 (Million dollars of 2002) Accumulated Variation 2000-2003 (Million dollarsof 2002)
Sector: Other Manufactures • This sector displays the most negative elasticity with respect to Chinese exports growth. This effect has increased throughout most of the sample. • The real exchange rate does not have a significant impact on exports. • The positive elasticity with respect to US imports is high but experienced slight a decline in early 2003. China´s Exports ( ) Real Exchange Rate ( ) Total US Imports ( )
Sector: Other Manufactures • In 1998-2000, Chinese exports had a minor negative impact on Mexican exports growth, which is explained almost entirelyby growing US imports. • In turn, Chinese exports affected Mexican exports considerably in the period 2000-2003. This effect was worsened by a reduction of US imports. Both effects were compensated by positive effects not captured by the control variables. Accumulated Variation 1998-2000 (Million dollarsof 2002) Accumulated Variation 2000-2003 (Million dollarsof 2002)
Total Variation of Exports of Manufactures • Fast growing US imports of manufactures account for the expansion of Mexican exports in 1998-2000. • In 2000-2003, the main causes for the low performance of Mexican exports were US imports and other factors captured by the error. Accumulated Variation 1998-2000 (Million dollarsof 2002) Accumulated Variation 2000-2003 (Million dollarsof 2002)
The results help to answer two questions: • What proportion of the yearly average fall of exports of manufactures in 2000-2003 is explained by each factor? • What proportion of the yearly average change in exports of manufactures is explained by each factor, if we compare 1998-2000 and 2000-2003? Decomposition of the Yearly Average Change in Exports Growth 1998-2000 vs. 2000-2003 (Percent) Decomposition of the Yearly Average Fall of Exports 2000-2003 (Percent)
Exports Recovery in 2004 • In 2004, the negative effects of Chinese expansion continued. However, the rebound of US imports had a strong positive impact on Mexican exports. • However, the accumulated effects of Chinese expansion since 2000, along with other factors that have affected exports growth, have not been compensated by the recovery observed in 2004. Accumulated Variation 2004 (Million dollarsof 2002) Accumulated Variation 2000-2004 (Million dollarsof 2002)
Index Mexican exports recent evolution What explains the behavior of exports? Sector-level estimation Subsector-level estimation Concluding remarks
Main Results • The largest negative effect of Chinese exports (in dollar terms) concentrated in the following sectors: Textiles, office and data processing machines, telecomm and audio equipment, furniture, apparel, clothing, and footwear. • The US import slowdown translated into lower exports (in dollar terms) in the follwing sectors: Iron and steel, office and data processing machines, telecomm and audio equipment, electrical machinery, and road vehicles. The last four sectors were also affected considerably by other factors. • These four sectors account for 94% of the reduction in exports of manufactures in 2000-2003.
Road Vehicles explain a large fraction of the exports fall in 2000-2003. This fall was caused by lower US imports and other factors. One of these factors was a shift in US demand away from GM, Ford, Chrysler vehicles. The majority of Mexican car exports are mainly from such brands. Cars and Light Trucks Sold in the US (Millions of units) US Market Share (Percent, GM and Ford on the left axis)
Index Mexican exports recent evolution What explains the behavior of exports? Sector-level estimation Subsector-level estimation Concluding remarks
In 2004, manufacturing and maquila exports have reflected mainly the recovery of US imports. Also, imports of intermediate goods anticipate future growth of industrial activity. Imports (SA data) Exports (SA data) Source: INEGI Source: INEGI
The recovery of the manufacturing sector complements the dynamism of other industrial and non-industrial activities. In 2004.II, GDP grew 3.9% in real annual terms and 1.2% over the previous quarter. Mexico: GDP (Real annual % change) GDP Growth by Sectors Source: INEGI.
Final Remarks • Lower exports in 2000-2003 are explained by the fall in US imports and other factors not captured by the analysis. Among these, there may be shifts in demand for Mexican products and competitiveness losses in some sectors. • The negative effects of lower US imports and other factors concentrated in four sectors (office and data processing machines, telecomm and audio equipment, electrical machinery, and road vehicles). These sectors account for 94% of the fall of exports in 2000-2003. • Chinese exports had a second-order effect. However, increased competition from China has become a permanent and growing challenge for Mexican exports.
China’s Effects on Mexican Exports Alejandro M. Werner October 2004