
EXAMPLE 1
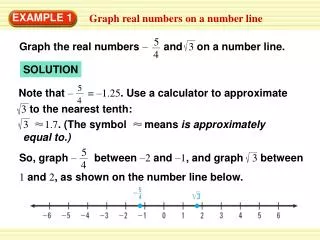
5. Graph the real numbers – and 3 on a number line. 4. 5. Note that – = –1.25 . Use a calculator to approximate 3 to the nearest tenth:. 4. 3 1.7 . (The symbol means is approximately equal to.). 5. So, graph – between –2 and –1 , and graph 3 between

EXAMPLE 1
E N D
Presentation Transcript
5 Graph the real numbers – and 3 on a number line. 4 5 Note that –= –1.25. Use a calculator to approximate 3 to the nearest tenth: 4 3 1.7. (The symbol means is approximately equal to.) 5 So, graph – between –2 and –1, and graph 3 between 1 and 2, as shown on the number line below. 4 EXAMPLE 1 Graph real numbers on a number line SOLUTION
ANSWER The correct answer is D. EXAMPLE 2 Standardized Test Practice SOLUTION From lowest to highest, the elevations are – 408, –156, –86, –40, –28, and –16.
7 1. Graph the numbers – 0.2, , –1, 2 , and –4 on a number line. 10 ANSWER 7 2 –4 –1 – 0.2 10 – 2 – 1 – 4 – 3 0 1 2 3 4 for Examples 1 and 2 GUIDED PRACTICE
2. Which list shows the numbers in increasing order? – 0.5, 1.5, – 2, – 0.75, 7 – 0.5, – 2, – 0.75, 1.5, 7 – 2, – 0.75, – 0.5, 1.5, 7 7 , 1.5, – 0.5 , – 0.75, – 2 ANSWER The correct answer is C. for Examples 1 and 2 GUIDED PRACTICE


