EXAMPLE 9.1 OBJECTIVE
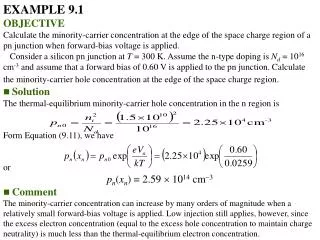
EXAMPLE 9.1 OBJECTIVE Calculate the minority-carrier concentration at the edge of the space charge region of a pn junction when forward-bias voltage is applied.

EXAMPLE 9.1 OBJECTIVE
E N D
Presentation Transcript
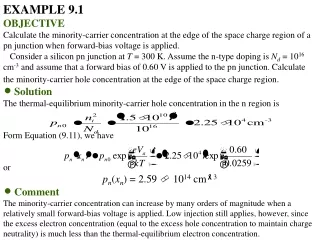
EXAMPLE 9.1 • OBJECTIVE • Calculate the minority-carrier concentration at the edge of the space charge region of a pn junction when forward-bias voltage is applied. • Consider a silicon pn junction at T = 300 K. Assume the n-type doping is Nd = 1016 cm-3 and assume that a forward bias of 0.60 V is applied to the pn junction. Calculate the minority-carrier hole concentration at the edge of the space charge region. • Solution The thermal-equilibrium minority-carrier hole concentration in the n region is Form Equation (9.11), we have or pn(xn) = 2.59 1014 cm3 • Comment • The minority-carrier concentration can increase by many orders of magnitude when a relatively small forward-bias voltage is applied. Low injection still applies, however, since the excess electron concentration (equal to the excess hole concentration to maintain charge neutrality) is much less than the thermal-equilibrium electron concentration.
EXAMPLE 9.2 • OBJECTIVE • Determine the ideal reverse-saturation current density in a silicon pn junction at T = 300 K. Consider the following parameters in a silicon pn junction: • Na = Nd = 1016 cm-3 ni = 1.5 1010 cm-3 • Dn = 25 cm2/s p0 = n0=5 10-7 s • Dp = 10 cm2/s r = 11.7 • Solution The ideal reverse-saturation current density is given by which can be rewritten as Substituting the parameters, we obtain Js = 4.15 10-11 A/cm2. • Comment • The ideal reverse-bias saturation current density is very small. If the pn junction cross-sectional area were A = 10-4 cm2, for example, then the ideal reverse-bias diode current would be Is = 4.15 10-15 A.
EXAMPLE 9.3 • OBJECTIVE • Calculate the forward-bias pn junction current. • Consider the pn junction described in Example 9.2 with a junction area of A = 10-4 cm2. Calculate the current for forward-bias voltages of Va = 0.5, 0.6, and 0.7 V. • Solution For forward-bias voltages, we can write For Va = 0.5 V, we obtain For Va = 0.6 V, we find For Va = 0.7 V, we have • Comment • We see, from this example, that significant pn junction currents can be induced for relatively small forward-bias voltages even though the reverse-saturation current is very small.
EXAMPLE 9.4 • OBJECTIVE • Design a pn junction diode to produce particular electron and hole current densities at given forward-bias voltage. • Consider a silicon pn junction diode at T = 300 K. Design the diode such that Jn = 20 A/cm2 and Jp = 5 A/cm2 at Va = 0.65 V. Assume the remaining semiconductor parameters are as given in Example 9.2. • Solution The electron diffusion current density is given by Equation (9.24) as Substituting the numbers, we have Which yieldsNa = 1.01 1015 cm-3 The hole diffusion current density is given by Equation (9.22) as Substituting the numbers, we have Which yieldsNd = 2.55 1015 cm-3 • Comment • The relative magnitude of the electron and hole current densities through a diode can be varied by changing the doping concentrations in the device.
EXAMPLE 9.5 • OBJECTIVE • To calculate the electric field required to produce a given majority-carrier drift current. • Consider a silicon pn junction at T = 300 K with the parameters given in Example 9.2 and with an applied forward-bias voltage Va = 0.65 V. • Solution The total forward-bias current density ids given by We determined the reverse saturation current density in Example 9.2, so we can write The total current far from the junction in the n region will be majority-carrier electron drift current, so we can write J = Jn enNd The doping concentration is Nd = 1016 cm-3, and if we assume n = 1350 cm2/V-s, then the electric field must be • Comment • We assumed, in the derivation of the current-voltage equation, that the electric field in the n-eutral p and n regions was zero. Although the electric field is not a zero, this example shows that the magnitude is very small-thus, the approximation of zero electric field is very good.
EXAMPLE 9.6 • OBJECTIVE • To determine the change in the forward-bias voltage of fa pn junction with a change in temperature. • Consider a silicon pn junction initially forward biased at 0.60 V at T = 300 K. Assume the temperature increases to T = 310 K. Calculate the change in forward-bias voltage required to maintain a constant current through the junction. Neglect the temperature effects on the density of states parameters. • Solution The forward-bias current can be written as follows: If the temperature changes, we can take the ratio of the diode currents at the two temperatures. This ratio is If current is to be held constant, then J1 = J2 and we must have Let T1 = 300 K, T2 = 310 K, Eg = 1.12 eV, and Va1 = 0.60 V. Then, solving for Va2, we obtain Va2 = 0.5827 V. • Comment • The change in the forward-bias voltage is – 17.3 mV for a 10C temperature change.
EXAMPLE 9.7 • OBJECTIVE • Calculate the reverse-saturation current density in a silicon Schottky diode. • Assume the barrier height is Bn = 0.67 V and the temperature is T = 300 K. • Solution We have or JsT = 6.29 10-5 A/cm2 • Comment • In general, the reverse-saturation current density in a Schottky barrier diode is several orders of magnitude larger than the reverse-saturation current density in a pn junction diode. This result is actually an advantage in several applications of Schottky diodes.
EXAMPLE 9.8 • OBJECTIVE • Calculate the forward-bias voltage required to generate a forward-bias current density of 25 A/cm2 in a Schottky diode and a pn junction diode. • Solution For the Schottky diode, we have Neglecting the (1) term, we can solve for the forward-bias voltage. We find For the pn junction diode, we have • Comment • A comparison of the two forward-bias voltages shows that the Schottky barrier diode has a turn-on voltage that, in this case, is approximately 0.4 V smaller than the turn-on voltage os the pn junction diode.
EXAMPLE 9.9 • OBJECTIVE • To calculate the small-signal admittance of a pn junction diode. • This example is intended to give an indication of the magnitude of the diffusion capacitance as compared with the junction capacitance considered in Chapter 5. The diffusion resistance will also be calculated. Assume that Na >> Nd so that pn0 >> np0. This assumption implies that Ip0 >> In0. Let T = 300 K, p0 = 10-7 s, and Ip0 = IDQ = 1 mA. • Solution The diffusion capacitance, with these assumptions, is given by The diffusion resistance is • Comment • The value of 1.93 nF for the diffusion capacitance of a forward-biased pn junction is 3 to 4 orders of magnitude larger than the junction or depletion capacitance of the reverse-biased ph junction that we found in Chapter 5. Typically, we found junction capacitances on the order of a few tenths of a pF. The forward-bias diffusion capacitance will also become important in bipolar transistors covered in Chapter 10.
EXAMPLE 9.10 • OBJECTIVE • Determine the relative magnitudes of the ideal reverse-saturation current density and the generation current density in a silicon pn junction at T = 300 K. • Consider the silicon pn junction described in Example 9.2 and let 0 = p0 = n0 = 5 10-7 s. • Solution The ideal reverse saturation current density was calculated in Example 9.2 and was found to be Js = 4.15 10-11 A/cm2. The generation current density is again given by Equation (9.61) as and the depletion width is given by If we assume, for example, that Vbi + VR = 5 V, then using the parameters given in Example 9.2 we find that W = 1.14 10-4 cm, and then calculate the generation current density to be Jgen = 2.74 10-7 A/cm2 • Comment • Comparing the solutions for the two current densities, it is obvious that, for the silicon pn junction diode at room temperature, the generation current density is approximately four orders of magnitude larger than the ideal saturation current density. The generation current is the dominant reverse-bias current in a silicon pn junction diode.
EXAMPLE 9.11 • OBJECTIVE • Determine the recombination current density. • Consider a silicon pn junction with the same parameters as considered in Example 9.10. (a) Determine the recombination current density for Va = 0.3 V. (b) determine the ratio of Jrec calculated in part (a) to the ideal diffusion current density at Va = 0.3 V. • Solution • We find that and or W = 0.320m
EXAMPLE 9.11 • Solution Then or Jrec = 2.52 10-5 A/cm2 (b) From Example 9.2, we found that JS = 4.15 10-11 A/cm2. So or JD = 4.45 10-6 A/cm2 Then • Comment • For a low value of forward-bias voltage, the recombination current dominates the total forward-bias current.
EXAMPLE 9.12 • OBJECTIVE • Design an ideal one-sided n+p junction diode to meet a breakdown vo0ltage specification. • Consider a silicon pn junction diode at T = 300 K. Assume that Nd = 3 1018 cm-3. Design the diode such that the breakdown voltage is VB = 100 V. • Solution From Figure 9.30, we find that the doping concentration in the low-doped side of a one-sided abrupt junction should be approximately 4 1015 cm-3 for a breakdown voltage of 100 V. For a doping concentration of 4 1015 cm-3, the critical electric field, from Figure 9.29, is approximately 3.7 105 V/cm. Then from Equation (9.83), the breakdown voltage is 110 V, which correlates quite well with the results from Figure 9.30. • Comment • As Figure 9.30 shows, the breakdown voltage increases as the doping concentration decreases in the low-doped region.