FSC
% Total. Data Analysis. FSC. SSC. FITC. PE. Mean. Geometric mean. CV. % of Parent. Mode. Median. % of Grandparent. Data Analysis. Experimental Design. Instrumentation. Analysis. Presentation. Sample Procurement Sample preparation Fix/Perm Which Fluorophore Controls

FSC
E N D
Presentation Transcript
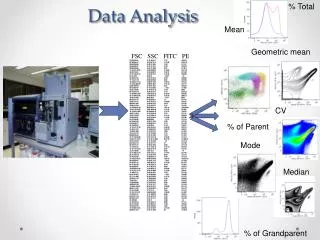
% Total Data Analysis FSC SSC FITC PE Mean Geometric mean CV % of Parent Mode Median % of Grandparent
Data Analysis Experimental Design Instrumentation Analysis Presentation • Sample Procurement • Sample preparation • Fix/Perm • Which Fluorophore • Controls • Isotype? • Single color • FMO • Appropriate Lasers • Appropriate Filters • Instrument Settings • Lin vs Log • Time • A, W, H Interpretation Mean, Median % + CV SD Signal/Noise Gating Histogram Dot Plot Density Plot Overlay Bar Graph
This will involve both the “what is” data analysis and the “how to”. Objective • Instrumentation (Mostly covered in “Flow Basics”) • Underlying Principles/Concepts • Proper Technique
First, lets address the problems • Data analysis incorporates many disciplines including instrumentation, statistics, biology, and photonics. Often times knowledge in one of these is limited • Many different instruments and software packages are available. • Historical precedent- • Unfortunately there is a large body of work published with poor data and no clear guidelines
Flow Basics • A quick look back to Flow Basics to see what we are analyzing Photons ElectronsVoltagepulseDigital #
Measurements of the Pulse Pulse Width Pulse Height Pulse Area Voltage Intensity Time
10 256 10 10,000 1 196 1000 6.21 volts .1 128 100 Relative Brightness (Volts) (Volts) Channel Number 3.54 volts .01 64 10 1.23 volts .001 0 1 0 (1mV) Photons=voltage=relative brightness
FCS FileorList Mode File Data APC-Cy7 PE APC FSC SSC FITC FCS File- The flow cytometry data file standard provides the information needed to completely describe flow cytometry data sets within the confines of the file containing the experimental data. It is made up of the Header, Text and Data. Current version is FSC 3.0
FCS file Text Keywords- value pairs that describe the experiment, the instrument, the specimen, the data and any other information which the file creator wishes to include. Some values are user defined, others are automatically entered
Histograms N=552 Frequency Histogram- is a summary graph showing a count of the data points falling in various ranges. The effect is a rough approximation of the frequency distribution of the data. # of Apples picked per tree N=7696 Frequency 0 101102103 104 Arbitrary Fluorescent units
Creation of a Histogram 0 101 102 103 104 Listmode File 12 9 6 3 PE
Dot Plots Dot plot- Frequency distributions of two simultaneously displayed parameters
Plots Contour Pseudo-color Histogram Greyscale Density Dot plot
Dot plots vs density or Pseudocolor 6,000,000 Events 6,000,000 4,500,000 3,000,000 1,500,000 600,000 300,000 150,000
Gating Selecting a subset of cells based on a specific fluorescent or scatter pattern. -Either graph can be OK -However “gated” may be more appropriate due to exclusion of artifact and non T cells No Gate CD3+ Gate 11.3% 59.8% 5.8% 30% Interpretation 11.3% of the WBC’s are positive for CD4 and 5.8% are positive for CD8 Interpretation 59.8% of the CD3+ cells are positive for CD4 and 30% are positive for CD8
Compensation Fluorescent Compensation- Due to broad emission profiles of fluorescent dyes, a single detector may process light from multiple dyes. The process of mathematically correcting for this spectral overlap is called compensation
Mean/Median/GeoMean • Mean • Sum of the “n” individual values of a group divided by n • NOT GOOD FOR Log DATA • More easily skewed by outliers • Geometric Mean • Multiply the ‘N” values of a cluster together and get the nth root of this product • Better for log data • Median • Divides your data in half • Probably the safest for Log data http://flowjo.typepad.com/the_daily_dongle/2007/10/mean-median-mod.html
Location of mean, median and mode with different distributions. Normal Left skew Right skew Driscoll P et al. J Accid Emerg Med 2000;17:274-281
This will involve both the “what is” data analysis and the “how to”. Objective • Instrumentation (Mostly covered in “Flow Basics”) • Underlying Principles/Concepts • Proper Technique
There is no wrong way to analyze your data • Meaning- Investigators are free to choose: • Which plot types for display • Placement of gates for analysis • Which statistics • # events to display or collect • Which software package to use • How many times you reanalyze
There is definitely a wrong way to analyze your data • Meaning- Investigators decisions can lead to incorrect data generation or interpretation: • Inappropriate gates for analysis (lymphocyte gate for CD15 staining, or inconsistent gates) • Misleading or inconsistent plots for display • Inappropriate controls (e.g. using isotype for gating) • Inappropriate number of events collected (too few events for meaningful and accurate statistical comparison)
Doublet discrimination • Cell cycle • Rare events • Dim cell lines Fiona Craig Flow Cytometric Immunophenotyping of Cerebrospinal Fluid SpecimensAJCP 2011 135:22-34 Cell aggregates were identified in 29 (16.4%) of 177 CSF specimens and represented 0 to 1,503 events and 0% to 80% of total acquired events Height Red=Singlets Blue=Doublets Width
Bi-exponential Scaling • Approximates log scaling at the upper end • Approximates linear scaling at the lower end • Can display events at or below zero • Improves visual separation of population at the low end of the scale http://ucflow.blogspot.com/2011/04/display-transformation-and-flowjo.html
Log scale Bi-exponential Herzenberg et al
Isotypes • Must be theexact same isotype • Conjugated to exactly the same degree Fluorophore/Protein ratio • Has the same background binding characteristics as your antibody • Different vendors use different conjugation protocols which may cause different characteristics • Used at the same concentration • Not used for gating purposes!!! • Rarely is more than the first criterion met.
FMO controls • FMO = Fluorescence minus one • The gating control contains all the fluorophores except the one of interest PE FITC Perfetto et al
Rare events The essential feature of Poisson distributions is that if N events are observed the standard deviation (SD) associated with that count is square root of N . The coefficient of variation (CV) is then given by CV = 100 X SD/ N or 100 / sqrt N. How many events to detect is more of a statistics questions than a flow cytometry question
Statistical Significance of Results • Determining the Number of Events to Collect
Rare Events Case Study #1 • Number of Events vs Measurement Precision .1%-.18% .07%-.1%
Rare Events Case Study #2 • Normal Kappa/Lambda ratio on B cells is .9-3.5 (polytypic) • When values fall outside this range it’s “clonal” • Often times in patients undergoing therapy there is a very low frequency of B cells to enumerate. Gated on CD19+ Bcells 20 Kappa/Lambda=58/20=2.9(Polytypic) But, √58=8 and √20=5 So actual values are 58±8/20±5 Which leads to ratio’s between 4.4 and 2. Is this clonal??????? 58
FACSDiVa • The Diva system first converts the analog signal to digital using a 14-bit ADC (16, 384 bins), then when the data is log transformed, it is multiplied by 16 (or 24) effectively adding 4 bits to the data making it 18-bit (262,144 bins). • It displays this data on a 5-decade scale, but then does not display the first decade. • What you’re left with is a 4-decade log scale (actually the scale goes above the 4th decade a little bit) with bins from 262,144 down to 262.
Dead Cell Exclusion Immunophenotyping Despite light scatter gate Rare event analysis Prefetto et al JIM 2006
Dump gate With dump gate Without dump gate
Light Scatter Laser Beam FSCDetector Collection Lens SSC Detector Original from Purdue University Cytometry Laboratories
Why Look at FSC v. SSC Granulocytes Lymphocytes SSC Monocytes RBCs, Debris, Dead Cells FSC • Since FSC ~ size and SSC ~ internal structure, a correlated measurement between them can allow for differentiation of cell types in a heterogenous cell population Dead LIVE
Automated clustering algorithms Aghaeepour N, Nikolic R, Hoos HH, Brinkman RR. Rapid cell population identification in flow cytometry. Cytometry A. 79(1):6-13, 2011. Zare H, Shooshtari P, Gupta A, Brinkman RR. Data reduction for spectral clustering to analyze high throughput flow cytometry data. BMC Bioinformatics. 11(1): 403, 2010.
Available Spectra Viewers • http://www.bdbiosciences.com/research/multicolor/spectrum_viewer/index.jsp • http://www.invitrogen.com/site/us/en/home/support/Research-Tools/Fluorescence-SpectraViewer.html • http://www.biolegend.com/spectraanalyzer
Data Analysis Feedback http://www.surveymonkey.com/s/K7WYTH7
References -Perfetto S, 2006 JIM 313 pg199-208 (live vs dead) -Keeney et al 1998 Cytometry -Cytometry 30(5), 1997 http://ucflow.blogspot.com/2011/04/display-transformation-and-flowjo.html (bi-exponential display) -Cytometry A 783A:384-385 -Seventeen-colourflow cytometry: unravelling the immune system -Stephen P. Perfetto, Pratip K. Chattopadhyay & Mario Roederer Nature Reviews Immunology 4, 648-655 (August 2004) -Interpreting flow cytometry data: a guide for the perplexed Herzenberg L, 2006 Nature Immunology Vol 7 Num 7 A practical approach to multicolor flow cyometry for immunophenotyping Baumgarth N, 2000 J. Imm. Methods 243 77-97 -Isotype controls in the Analysis of Lymphocyte and CD34+ stem and progenitor cells by Flow Cytometry-Time to Let Go! Keeney, M 1998 Cytomery (Communication in Clincal Cytometry 34: 280-283
# of Parameters 1 2 3 4 5 6 7 8 9 10 # of possible plots 1 1 3 6 10 15 21 28 36 45