Download
1 / 20
200 likes | 337 Vues
This guide explores key concepts from economics, particularly focusing on how models, like the Production Possibilities Frontier (PPF), are utilized to analyze complex economic scenarios. Learn the distinction between positive and normative analysis, and discover how economists view trade-offs in production, represented by the PPF curve. Key discussions include opportunity costs, efficiency versus inefficiency, and the impact of resource allocation. The PPF serves as a foundational illustration of economic principles, aiding in understanding growth and decision-making in production.

E N D
P R I N C I P L E S O F FOURTH EDITION Thinking Like An Economist 2
Dr. Straszheim’s Reader’s Guide – Ch. 2 • 1. Economists use models (simple abstractions) to analyze complex subjects. “Positive analysis seeks to describe the world, while “normative” analysis prescribes policies. The latter involve value or political judgments, about persons often disagree; hence, economists often disagree on the latter. • 2. Note the activities of firms vs. households and product markets vs. factor markets. We will not study the Circular Flow Model. • 3. The Production Possibilities Frontier is an elementary model illustrating scarcity and tradeoffs. Review the concept of opportunity costs and how it changes along the frontier. CHAPTER 2 THINKING LIKE AN ECONOMIST
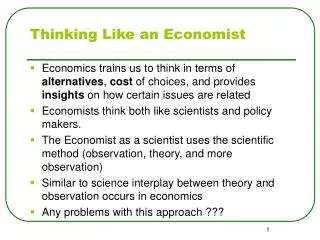
In this chapter, look for the answers to these questions: • What are economists’ two roles? How do they differ? • What are models? How do economists use models? • What are the elements of the Circular-Flow Diagram? What concepts does this diagram illustrate? • How is the Production Possibilities Frontier related to opportunity cost? What other concepts does it illustrate? • What is the difference between microeconomics and macroeconomics? Between positive and normative? CHAPTER 2 THINKING LIKE AN ECONOMIST
Our Second Model: The Production Possibilities Frontier 0 • The Production Possibilities Frontier (PPF): A graph that shows the combinations of two goods the economy can possibly produce given the available resources and the available technology. • Example: • Two goods: computers and wheat • One resource: labor (measured in hours) • Economy has 50,000 labor hours per month available for production. CHAPTER 2 THINKING LIKE AN ECONOMIST
Employment of labor hours Production Computers Wheat Computers Wheat A 50,000 0 500 0 B 40,000 10,000 400 1,000 C 25,000 25,000 250 2,500 D 10,000 40,000 100 4,000 E 0 50,000 0 5,000 PPF Example 0 • Producing one computer requires 100 hours labor. • Producing one ton of wheat requires 10 hours labor.
PPF Example E D C B A CHAPTER 2 THINKING LIKE AN ECONOMIST
The PPF: What We Know Far • Points on the PPF (like A – E) • possible • efficient: all resources are fully utilized • Points under the PPF (like F) • possible • not efficient: some resources underutilized (e.g., workers unemployed, factories idle) • Points above the PPF (like G) • not possible CHAPTER 2 THINKING LIKE AN ECONOMIST
The PPF and Opportunity Cost • Recall: The opportunity cost of an item is what must be given up to obtain that item. • Moving along a PPF involves shifting resources (e.g., labor) from the production of one good to the other. • Society faces a tradeoff: Getting more of one good requires sacrificing some of the other. • The slope of the PPF tells you the opportunity cost of one good in terms of the other. CHAPTER 2 THINKING LIKE AN ECONOMIST
slope = The PPF and Opportunity Cost The slope of a line equals the “rise over the run” – the amount the line rises when you move to the right by one unit. –1000 = –10 100 Here, the opportunity cost of a computer is 10 tons of wheat. CHAPTER 2 THINKING LIKE AN ECONOMIST
Economic Growth and the PPF With additional resources or an improvement in technology, the economy can produce more computers, Economic growth shifts the PPF outward. more wheat, or any combination in between. CHAPTER 2 THINKING LIKE AN ECONOMIST
The Shape of the PPF • The PPF could be a straight line, or bow-shaped • Depends on what happens to opportunity cost as economy shifts resources from one industry to the other. • If opp. cost remains constant, PPF is a straight line. (In the previous example, opp. cost of a computer was always 10 tons of wheat.) • If opp. cost of a good rises as the economy produces more of the good, PPF is bow-shaped. CHAPTER 2 THINKING LIKE AN ECONOMIST
Why the PPF Might Be Bow-Shaped At point A, most workers are producing beer, even those that are better suited to buildingmountain bikes. So, do not have to give up much beer to get more bikes. At A, opp. cost of mtn bikes is low. A Beer Mountain Bikes CHAPTER 2 THINKING LIKE AN ECONOMIST
Why the PPF Might Be Bow-Shaped • So, PPF is bow-shaped when different workers have different skills, different opportunity costs of producing one good in terms of the other. • The PPF would also be bow-shaped when there is some other resource, or mix of resources with varying opportunity costs. • E.g., different types of land suited for different uses CHAPTER 2 THINKING LIKE AN ECONOMIST
The PPF: A Summary • The PPF shows all combinations of two goods that an economy can possibly produce, given its resources and technology. • The PPF illustrates the concepts of tradeoff and opportunity cost, efficiency and inefficiency, unemployment, and economic growth. • A bow-shaped PPF illustrates the concept of increasing opportunity cost. CHAPTER 2 THINKING LIKE AN ECONOMIST
The Economist as Policy Advisor • As scientists, economists make positive statements, which attempt to describe the world as it is. • As policy advisors, economists make normative statements, which attempt to prescribe how the world should be. • Positive statements can be confirmed or refuted, normative statements cannot. • Govt employs many economists for policy advice. E.g., the U.S. President has a Council of Economic Advisors, which the author of this textbook recently chaired. CHAPTER 2 THINKING LIKE AN ECONOMIST
ACTIVE LEARNING 3: Identifying positive vs. normative Which of these statements are “positive” and which are “normative”? How can you tell the difference? a. Prices rise when the government increases the quantity of money. b. The government should print less money. c. A tax cut is needed to stimulate the economy. d. An increase in the price of gasoline will cause an increase in consumer demand for video rentals. 15
ACTIVE LEARNING 3: Answers a. Prices rise when the government increases the quantity of money. Positive, describes a relationship, could use data to confirm or refute. b. The government should print less money. Normative, this is a value judgment, cannot be confirmed or refuted. 16
Why Economists Disagree • Economists often give conflicting policy advice. • They sometimes disagree about the validity of alternative positive theories about the world. • They may have different values and, therefore, different normative views about what policy should try to accomplish. • Yet, there are many propositions about which most economists agree. CHAPTER 2 THINKING LIKE AN ECONOMIST
Propositions about Which Most Economists Agree (and % agreeing) • A ceiling on rents reduces the quantity and quality of housing available. (93%) • Tariffs and import quotas usually reduce general economic welfare. (93%) • A large federal budget deficit has an adverse effect on the economy. (83%) • A minimum wage increases unemployment among young and unskilled workers. (79%) • Effluent taxes and marketable pollution permits represent a better approach to pollution control than imposition of pollution ceilings. (78%) CHAPTER 2 THINKING LIKE AN ECONOMIST
CHAPTER SUMMARY • As scientists, economists try to explain the world using models with appropriate assumptions. • Two simple models are the Circular-Flow Diagram and the Production Possibilities Frontier. • Microeconomics studies the behavior of consumers and firms, and their interactions in markets. Macroeconomics studies the economy as a whole. • As policy advisers, economists offer advice on how to improve the world. CHAPTER 2 THINKING LIKE AN ECONOMIST