Download
1 / 21
210 likes | 404 Vues
Thinking Like an Economist. Chapter 2. Economics trains you to. Be mindful about the choices that you make. Evaluate the cost of individual and social choices. Examine and understand how certain events and issues are related.

E N D
Thinking Like an Economist Chapter 2
Economics trains you to. . . . • Be mindful about the choices that you make. • Evaluate the cost of individual and social choices. • Examine and understand how certain events and issues are related. • But there is the issue of terminology, some math, and GRAPHS, GRAPHS AND SOME MORE GRAPHS!
The Economist as a Scientist The economic way of thinking . . . • Involves thinking analyticallyandobjectively. • Makes use of thescientific method. • Involves the use of abstract models to focus the discussion on a main idea or theme in the complexity of the real world. • To apply the scientific method in economics, assumptions are used to make the world easier to understand. • Ceteris Paribus Assumption-All else equal. • Role Play Scenario-Purchasing something at a store.
Economic Models Economists use models to simplify reality in order to improve our understanding of the world. As simplifications of reality, models need assumptions. A Model of Boids Flying Models start small and then grow in increasing complexity. Play Bolero by Maurice Ravel
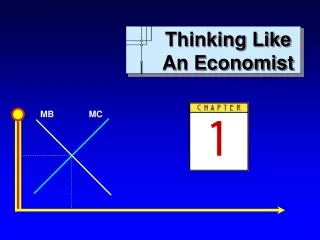
Graphing Data • A graph reveals a causal relationship between two variables. • The vertical line is the y-axis. • Independent variable. • The horizontal line is the x-axis. • Dependent variable. • How do we show a negative and a positive relationship between variables?
Two Simple Rules for Movements vs. Shifts • Rule One • When an independent variable changes and that variable does not appear on the graph, the curve on the graph will shift. • Rule Two • When an independent variable changes and does appear on the graph, a movement along the existing curve will occur. The curve will not shift.
Graphing Data • Economists use three types of graphs to reveal relationships between variables. They are: • Time-series graphs • Cross-section graphs • Scatter diagrams
Two of the Most Basic Economic Models Are • The Circular Flow Diagram • The Production Possibilities Frontier.
Revenue Spending Goods & Services sold Goods & Services bought Inputs for production Labor, land, and capital Wages, rent, and interest Income The Circular-Flow Diagram Market for Goods and Services Firms Households Market for Factors of Production
Journal Assignment-Circular Flow Diagram • Draw a circular flow diagram. • Identify the parts of the model that correspond to the flow of goods and services and the flow of dollars for each of the following activities: • Sam pays a storekeeper $1 for a quart of milk. • Sam gets a quart of milk. • Sally earns $4.50 per hour working at a fast food restaurant. • Sally works at the restaurant.
The Production Possibilities Frontier Shows the various combinations of two goods that can be produced by one firm. Assumes two goods Assumes fixed technology and fixed factors of production.
D C 2,200 A 2,000 B 1,000 700 0 300 600 The Production Possibilities Frontier Quantity of Computers Produced 3,000 Quantity of Cars Produced 1,000
The Production Possibilities Frontier Quantity of Computers Produced D 3,000 C 2,200 A 2,000 Production possibilities frontier B 1,000 Quantity of Cars Produced 700 0 300 600 1,000
Concepts Illustrated by the Production Possibilities Frontier • Efficiency • Tradeoffs • Opportunity Cost • Economic Growth
4,000 E 2,100 750 Quantity of Computers Produced The Production Possibilities Frontier An outward shift in the production possibilities frontier Increase in technology to produce computers. 3,000 2,000 A Quantity of Cars Produced 700 0 1,000
Microeconomics and Macroeconomics • Microeconomicsfocuses on the individual parts of the economy. • How households and firms make decisions and how they interact in specific markets • Macroeconomicslooks at the economy as a whole. • How the markets, as a whole, interact at the national level.
Two Roles of Economists • When they are trying to explain the world, they arescientists. • When they are trying to change the world, they arepolicymakers.
Positive versus Normative Analysis • Positive statementsare statements that describe the world as it is. • Called descriptive analysis • Normative statementsare statements about how the world should be. • Called prescriptive analysis
Why Economists Agree and Disagree • We agree on the methodology, but not on the underlying assumptions underlying incentives and behavior. • Example-No Child Left Behind and Test Scores.