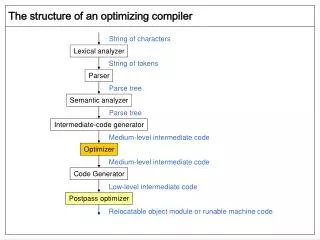
Scope NAMP (Organization Level, Intermediate level and Depot level)
10 likes | 184 Vues
Objectives A Demand Categorization scheme Compare relevant demand forecasting techniques; the measures of performance being error Study the effect of aggregation of demand history and the demand attributes.

Scope NAMP (Organization Level, Intermediate level and Depot level)
E N D
Presentation Transcript
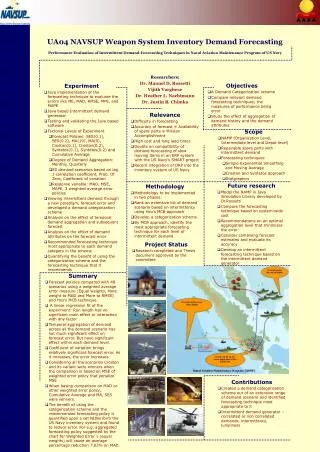
Objectives • A Demand Categorization scheme • Compare relevant demand forecasting techniques; the measures of performance being error • Study the effect of aggregation of demand history and the demand attributes UA04 NAVSUP Weapon System Inventory Demand Forecasting Performance Evaluation of Intermittent Demand-Forecasting Techniques in Naval Aviation Maintenance Program of US Navy • Researchers: • Dr. Manuel D. Rossetti • Vijith Varghese • Dr. Heather L. Nachtmann • Dr. Justin R. Chimka • Experiment • Java implementation of the forecasting technique to evaluate the errors like ME, MAD, RMSE, MPE, and MAPE • Java based Intermittent demand generator • Testing and validating the Java based software • Factorial Levels of Experiment • Forecast Policies: SES(0.1), SES(0.2), MA(19), MA(9), Croston(0.1), Croston(0.2), Syntetos(0.1), Syntetos(0.2) and Cumulative Average • Degree of Demand Aggregation: Monthly, Quarterly • 80 demand scenarios based on lag 1 correlation coefficient, Prob. Of Zero, Coefficient of variation • Response variable: MAD, MSE, MAPE, 3 weighted average error policies • Viewing intermittent demand through a new paradigm, forecast error and developed a demand categorization scheme • Analysis on the effect of temporal demand aggregation and subsequent forecast • Analysis on the effect of demand attributes on the forecast error • Recommended forecasting technique most appropriate to each demand category in the scheme • Quantifying the benefit of using the categorization scheme and the forecasting technique that it recommends • Relevance • Difficulty in forecasting • Accuracy of forecast ≡ Availability of spare parts ≡ Mission Accomplishment • High cost and long lead times • Doubts on compatibility of demand forecasting of slow moving items in an ERP system with the US Navy’s SMART project • Recent integration of DRP into the inventory system of US Navy. • Scope • NAMP (Organization Level, Intermediate level and Depot level) • Repairable spare parts with intermittent demand • Forecasting techniques • Simple Exponential Smoothing and Moving Average • Croston and Syntetos approach • Statgraphics Future research • Model the NAMP in Java Simulation Library developed by Dr.Rossetti • Compare the forecasting technique based on system-wide cost • Recommendations on an optimal aggregation level that minimizes the error • Consider combining forecast estimates and evaluate its accuracy • Develop an intermittent forecasting technique based on the intermittent demand generator • Methodology • Methodology to be implemented in two phases: • Rank an extensive list of demand scenario based on intermittency using Hsu’s MCB approach • Develop a categorization scheme • By MCB approach, identify the most appropriate forecasting technique for each level of intermittent demand. • Project Status • Research completed and Thesis document approved by the committee • Summary • Forecast policies compared with 48 scenarios using a weighted average error measure (Equal weights, More weight to MAD and More to RMSE) and Hsu’s MCB technique. • A linear regression fit of the experiment: Run length has no significant main effect or interaction with any factor • Temporal aggregation of demand across all the demand scenario has not much significant effect on forecast error. But have significant effect within each demand level. • Coefficient of variation brings relatively significant forecast error. As it increases, the error increases • Considering all the scenarios Croston and its variant were winners when the comparison is based on MSE of weighted error policy that penalize MSE • When basing comparison on MAD or other weighted error policy, Cumulative Average and MA, SES were winners. • The benefit of using the categorization scheme and the recommended forecasting policy is quantified upon a set NIINs form the US Navy inventory system and found to reduce error. For e.g. aggregated forecasting policy suggested by the chart for Weighted Error 1 (equal weights) will cause an average percentage reduction 7.03% on MAD. • Contributions • Created a demand categorization scheme out of an extensive range of demand scenario and identified forecasting technique most appropriate to it • Intermittent demand generator – correlated or non correlated demands, intermittency, lumpiness