Download
1 / 36
360 likes | 482 Vues
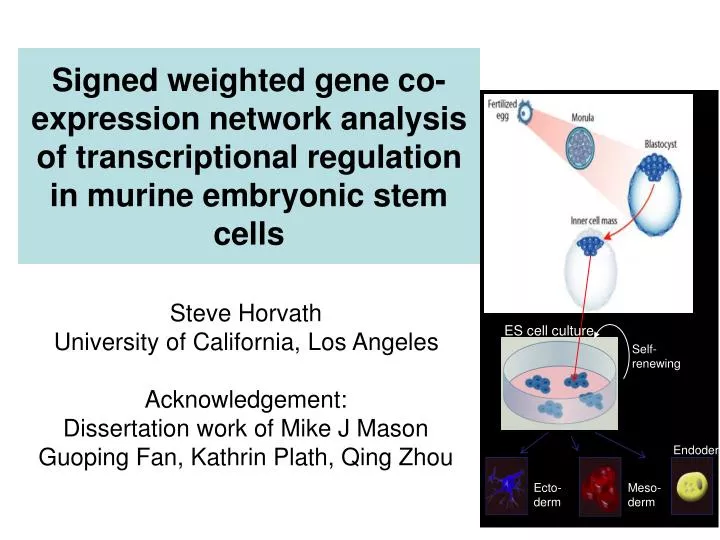
ES cell culture. Self- renewing. Endoderm. Ecto- derm. Meso- derm. Signed weighted gene co-expression network analysis of transcriptional regulation in murine embryonic stem cells. Steve Horvath University of California, Los Angeles Acknowledgement: Dissertation work of Mike J Mason

E N D
ES cell culture Self- renewing Endoderm Ecto- derm Meso- derm Signed weighted gene co-expression network analysis of transcriptional regulation in murine embryonic stem cells Steve Horvath University of California, Los Angeles Acknowledgement: Dissertation work of Mike J Mason Guoping Fan, Kathrin Plath, Qing Zhou
Contents • Weighted Gene Co-Expression Network Analysis • Application to stem cell data
How to construct a weighted gene co-expression network?Bin Zhang and Steve Horvath (2005) "A General Framework for Weighted Gene Co-Expression Network Analysis", Statistical Applications in Genetics and Molecular Biology: Vol. 4: No. 1
Undirected Network=Adjacency Matrix • A network can be represented by an adjacency matrix, A=[aij], that encodes whether/how a pair of nodes is connected. • A is a symmetric matrix with entries in [0,1] • For unweighted network, entries are 1 or 0 depending on whether or not 2 nodes are adjacent (connected) • For weighted networks, the adjacency matrix reports the connection strength between gene pairs
Steps for constructing aco-expression network • Gene expression data • Measure concordance of gene expression with a Pearson correlation • C) The Pearson correlation matrix is either dichotomized to arrive at an unweighted adjacency matrix unweighted network • Or transformed continuously with the power adjacency function weighted network
Power adjacency function for constructing unsigned and signed weighted gene co-expr. networks Default values: beta=6 for unsigned and beta=12 for signed networks. Alternatively, use the “scale free topology criterion” described in Zhang and Horvath 2005.
Comparing adjacency functions for transforming the correlation into a measure of connection strength Unsigned Network Signed Network
Why soft thresholding as opposed to hard thresholding? • Preserves the continuous information of the co-expression information • Results tend to be more robust with regard to different threshold choices But hard thresholding has its own advantages: In particular, graph theoretic algorithms from the computer science community can be applied to the resulting networks
Question: Are signed correlation networks superior to unsigned networks? Answer: Overall, recent applications have convinced me that signed networks are preferable. • For example, signed networks were critical in a recent stem cell application • Michael J Mason, Kathrin Plath, Qing Zhou, SH (2009) Signed Gene Co-expression Networks for Analyzing Transcriptional Regulation in Murine Embryonic Stem Cells. BMC Genomics 2009, 10:327
Re-analysis of published microarray data sets • Ivanova N, Dobrin R, Lu R, Kotenko L, Levorse J, DeCoste C, Schafer X, Lun Y, Lemischka I: Discecting self-renewal in stem cells with RNA interference.Nature 2006, 442:533-538 • Zhou Q, Chipperfield H, Melton DA, Wong WH: A gene regulatrory network in mouse embryonic stem cells. Proc Natl Acad Sci 2007, 104(42):16438-16443.
ES Cell Datasets Used • Ivanova et al.: RNA knockdown of 8 TFs thought to play a role in pluripotency • Zhou et al.: ES cell samples and differentiated cell samples sorted into Oct4 positive and negative groups ES / Oct4+ Oct4- ES / Oct4+ Oct4-
As default, we define modules as branches of a cluster tree • We use average linkage hierarchical clustering which inputs a measure of interconnectedness • often the topological overlap measure • Once a dendrogram is obtained from a hierarchical clustering method, we define modules as branches using a branch cutting method • dynamicTreeCut R package (Peter Langfelder et al 2007)
How to cut branches off a tree? Module=branch of a cluster tree Module genes are assigned the same color Bioinformatics 2008 24(5):719-720
Signed WGCNA finds a pluripotency related module, which cannot be found in an unsigned network analysis Pluripotency module
Question: How does one summarize the expression profiles in a module?Math answer: module eigengene= first principal componentNetwork answer: the most highly connected intramodular hub geneBoth turn out to be equivalent
Module Eigengene= measure of over-expression=average redness Rows,=genes, Columns=microarray The brown module eigengenes across samples
Eigengene-based connectivity, also known as kME or module membership measure kME(i) is simply the correlation between the i-th gene expression profile and the module eigengene. Very useful measure for annotating genes with regard to modules. Module eigengene turns out to be the most highly connected gene
Construct a network Rationale: make use of interaction patterns between genes Identify modules Rationale: module (pathway) based analysis Relate modules to external information Array Information: RNAi knock-out Gene Information: gene ontology, DNA binding data, epigenetic Rationale: find biologically interesting modules • Study Module Preservation across different data • Rationale: • Same data: to check robustness of module definition • Example Ivanova versus Zhou data Find the key drivers in interesting modules Tools: intramodular connectivity kME Rationale: experimental validation, novel genes
What is different from other analyses? • Emphasis on modules (pathways) instead of individual genes • Greatly alleviates the problem of multiple comparisons • Less than 20 comparisons versus 20000 comparisons • Use of intramodular connectivity kME to find key drivers • Quantifies module membership (centrality) • If the module is preserved, intramodular hub genes are preserved as well • Module definition is based on gene expression data only • No prior pathway information is used for module definition • Two module (eigengenes) can be highly correlated • Typically defined by cutting branches of a cluster tree • Emphasis on a unified approach for relating variables • Default: power of a correlation • Technical Details: soft thresholding with the power adjacency function, topological overlap matrix to measure interconnectedness
Oct4 RNAi knock out status gives rise to a gene significance measure Possible definitions • We defined a measure of gene significance (GS) as the t-statistic from the paired Student's t-test of expression in control RNAi samples and ES cell samples with RNAi knock down of Oct4 (paired by day of treatment) • GS could also be a fold change • GS(i)=|T-test(i)| of differential expression • GS(i)=-log(p-value)
A gene significance naturally gives rise to a module significance measure • Define module significance as mean gene significance • Often highly related to the correlation between module eigengene and trait
The Black Module Contains Genes Involved in Pluripotency The genes of this module are significantly more likely to be bound by key regulators of pluripotency and self-renewal
The blue module contains transcription factors involved in differentiation
Module Membership and Binding Information in the Signed Ivanova et al (2006) Network. This file contains module membership, kME, and binding data from Loh et al (2006), Boyer et al (2007), and Chen et al (2008) for each gene on the microarray.
Signed WGCNA finds Novel Pathways Involved in Pluripotency in Zhou dataset Nup133 is ranked 29th by connectivity and 777th by fold change
Epigenetic Regulation and Module Membership • Recent studies suggest that chromatin structure and epigenetic modifications, like histone modification and DNA methylation, play a role in controlling gene expression during ES cell self-renewal and differentiation. • For example, gene repression by the PcG protein complex via histone H3 lysine 27 trimethylation (H3K27me3) is required for ES cell self-renewal and pluripotency. • To understand how epigenetic variables contribute to the regulation of ES cells we studied the relationship of the pluripotency and differentiation modules with ES cell H3K4 and H3K27 trimethylation, DNA methylation, and CpG promoter content from previously published data sets. • Data from Guenther et al. Cell 2007
Relating Module Membership to Epigenetic Regulation. • The y-axis reports the proportion of top 1000 genes that are known to belong to the group of genes defined on the x-axis. • Histone H3K4me3 trimethylation status is abbreviated K4, H3K27me3 trimethylation status is abbreviated by K27. • Note that genes with promoter CpG methylation are significantly (p = 2.0 × 10⁻¹⁴) under-enriched with respect to the top 1000 black module genes.
Analysis of variancemodule membership (kME) versus epigenetic variables
Comparison of gene screening based on kME versus screening based on differential expression • Venn diagrams show the amount of gene overlap between the top 1000 black (pluripotency) module genes and the top 1000 genes most significantly down-regulated upon Oct4 RNAi (left) • gene overlap between the top 1000 blue (differentiation) module genes and the 1000 genes most significantly up-regulated with Oct4 RNAi (right). • Ivanova et al data set. Grey: Standard differential expression analysis Green: genes with highest module membership kME Green= Black module genes
Module genes (green) have more significant enrichment than those found by a standard differential expression analysis
Conclusion • Signed WGCNA • has more consistent gene rankings between data sets, • is better able to identify functionally enriched groups of genes • Focus on module eigengenes circumvents the multiple testing problems that plague standard gene-based expression analysis. • kME =module membership is very useful • kME based gene screening identifies several novel stem cell related genes that would not have been found using a standard differential expression analysis • kME is valuable for annotating genes with regard to module membership and for identifying genes related to pluripotency and differentiation • Can be used as input of analysis of variance to dissect which factors contribute to module membership
Software and Data Availability • R software tutorials etc can be found online • Google search • weighted co-expression network • “WGCNA” • “co-expression network” • http://www.genetics.ucla.edu/labs/horvath/CoexpressionNetwork
Acknowledgement • Dissertation work ofMike J Mason • Collaborators: Guoping Fan, Kathrin Plath, Qing Zhou • WGCNA R package: Peter Langfelder