Download
1 / 40
400 likes | 502 Vues
Delve into statistical concepts, from distorted graphs to inference making, with real-life examples and practical tools. Explore various biases, visualization techniques, measures of variation, and the importance of sample size in statistical inference. Understand the difference between relationships and cause and effect through engaging explorations in data interpretation. Discover the significance of correlation and how statistical analysis shapes our understanding of the world around us.

E N D
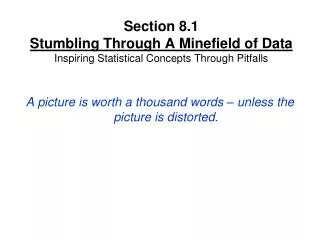
Section 8.1Stumbling Through A Minefield of DataInspiring Statistical Concepts Through Pitfalls A picture is worth a thousand words – unless the picture is distorted.
Question of the Day Would you answer the following question honestly in public: Have you been drunk in the past 48 hours?
Collecting Data Leading and misleading data Surveys can produce skewed results by phrasing the questions in ways that might bias the answers.
Collecting Data Sample Bias – Polluted Pools The answers we get often depend on whom we ask.
Collecting Data Where could bias occur in every day life?
Collecting Data Are we asking the right question? • What is the question? • What role will the data play in answering that question?
Section 8.2Getting Your Data to Shape UpOrganizing, Describing, and Summarizing Data Search for the most effective means of making your case.
Question of the Day What do these numbers have in common: 3.23, 0.360, 82, 1.08, 2,500,000.
Visualizing Data Pie Charts
Visualizing Data Stem and Leaf Plot
Visualizing Data Histogram
Summarizing Data Measures of Center (Averages) Mean – the sum of all the numerical data divided by the number of data points. Median – the middle data point when the data are lined up in numerical order.
Measuring Variation Five-Number Summary: Minimum Value First Quartile Second Quartile (Median) Third Quartile Maximum Value
Measuring Spread Standard Deviation – a measure of how far the average data point differs (or deviates) from the mean.
The Shape of Graphs Skewed graphs
The Shape of Graphs Bimodal Distributions
Section 8.3Looking at Super ModelsMathematically Described Distributions All models are wrong. Some are useful. George E. P. Box
Question of the Day Who was a better batter: Joe Jackson or Moises Alou?
Section 8.4Go FigureMaking Inference from Data If the going gets tough, do something else.
Question of the Day If you flip a coin 100 times and see heads only 41 times, how confident are you that your coin is fair?
The Ideas Behind Statistical Inference Setting 1: There exists a fixed collection of data, but we only know a sample of it. Our goal is to infer the data of the entire population from analyzing that sample.
The Ideas Behind Statistical Inference Setting 2: Some fact about reality is unknown, and so we employ statistical analyses to help us determine what is most likely true.
The Ideas Behind Statistical Inference Setting 3: Reality contains some probabilistic feature and we use a random sample to determine what the chances are.
Confidence Intervals “Poll shows that Arnold Schwarzenegger will receive 46% of the vote with a margin of error.” What does that statement mean?
When is enough enough? The sample size is more important than the sample’s percentage of the overall population. For 95% confidence, a sample size n will have a margin of error of approximately
Section 8.5War, Sports, and TigersStatistics Throughout Our Lives Whenever possible, create an experiment and study the outcomes.
Question of the Day Is every possible number equally likely in a lottery?
The Birth of Genetics Examining data can drawing conclusions from it can have profound consequences.
Relationships versus Cause and Effect When we observe that two quantities vary in a related manner, it is natural to wonder if one is the cause of the other. BEWARE!
Measuring Relationships Correlation – the extent to which a relationship exists.