Download
1 / 60
630 likes | 1.62k Vues
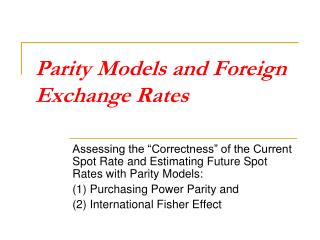
Parity Models and Foreign Exchange Rates. Assessing the “Correctness” of the Current Spot Rate and Estimating Future Spot Rates with Parity Models: (1) Purchasing Power Parity and (2) International Fisher Effect. What are Parity Models?. Parity is defined as a state of equilibrium.

E N D
Parity Models and Foreign Exchange Rates Assessing the “Correctness” of the Current Spot Rate and Estimating Future Spot Rates with Parity Models: (1) Purchasing Power Parity and (2) International Fisher Effect
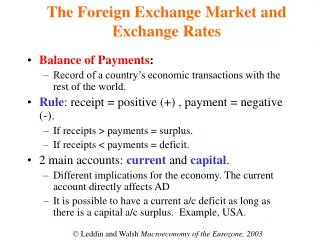
What are Parity Models? • Parity is defined as a state of equilibrium. • Foreign exchange parity models “estimate” what the equilibrium spot exchange rate should be (under the model’s assumptions): • Is today’s spot rate appropriate? • What might the spot rate be in the future (forecasting). • Generally a long term forecasting horizon. • Parity models have an economic basis (i.e., theory) for their spot rate determination.
Why are Parity Models Important? • Testing the “correctness” of a spot rate. • Could be important for a trading strategy. • Is the currency overvalued or undervalued? • Overvalued: perhaps a sell short strategy. • Undervalued: perhaps a buy long strategy. • Establishing a future spot rate • Could be important for: • International capital budgeting decisions • Converting estimated foreign currency cash flows into MNC’s home currency as part of the capital budgeting process. • Investment and Financing decisions • Converting estimated investment inflows into home currency equivalents and converting estimated financing outflows into home currency equivalents.
Two Major Spot FX Parity Models • Purchasing Power Parity (PPP) • Model based on relative rates of inflation between two countries as the determinant of the spot exchange rate. • International Fisher Effect (IFE) • Model based on relative rates of interest between two countries as the determinant of the spot exchange rate.
Purchasing Power Parity Theory • The Purchasing Power Parity (PPP) explains and quantifies the relationship between inflation and spot exchange rates. • The theory states that the spot exchange rate between two currencies should be equal to the ratio of the two countries’ price levels. • Idea was first proposed by the classical economist, David Ricardo, in the 19th century. • The concept was fully developed by the Swedish economists, Gustav Cassel, during the years after WW1 (1918 -) when countries in Europe were experiencing hyperinflation.
Two Forms of PPP • Absolute PPP: • In equilibrium, when adjusted for exchange rates, the prices of similar goods in two different countries should be equal. • This form of the PPP is used to test how appropriate the current spot exchange rate is. • Relative PPP: • Over time, the change in the exchange rate between two currencies should be equal to the rate of change in the prices of similar goods between the two countries. • This form of the PPP is used to forecast the equilibrium spot exchange rate in the future.
Rationale Behind the PPP: The Law of One Price • The Purchasing Power Parity model is based on the Law of One Price: • The Law of One Price states that all else equal (i.e., no transaction costs or other frictions, like tariffs or cultural differences) a product’s price should be the same in all markets. • Why will the product’s price be the same? • The principle of competitive markets assumes that prices will equalize as consumers shift their purchases to those markets (or countries) where prices are the lowest.
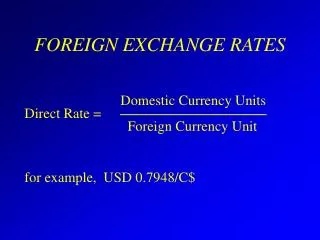
Absolute PPP and Exchange Rates • The Absolute PPP states that, in equilibrium after adjusting for exchange rates, the prices for similar products should be the same. • Based on Law of One Price. • Example (Using the U.S. and Japan): • In equilibrium the price of a product in the U.S. in US dollars (P$), adjusted by the spot exchange rate, should equal the price of the same product in Japan in Japanese yen (P¥), or: • P$ Spot rate = P¥ • This formula is the Law of One Price formula.
Example: Law of One Price • Assume: • A Big Mac hamburger costs $2.00 in the United States and • The current yen spot exchange rate (USD/JPY) is ¥120.00 • According to the Law of One Price, the “equilibrium” Big Mac hamburger price in Japan is: • P$ Spot Rate = P¥ • $2.00 x ¥120.00 = ¥240.00 • At these two prices ($2.00 and ¥240) and given the spot exchange rate (120) there is no difference in exchange rate adjusted prices for the Big Mac between the United States and Japan.
The Absolute PPP Spot Exchange Rate • We can arrange the Law of One Price formula, which is P$ Spot Rate = P¥, to calculate the Absolute PPP Spot Exchange Rate: • Absolute PPP Spot Rate = P¥ /P$ • Note: The Absolute PPP is calculated by the ratio of the two local currency prices • The Absolute PPP spot exchange rate is the “equilibrium” spot exchange rate which will result in the prices of similar goods in one country to be equal to the prices of those goods in another country.
Example: Calculating the Absolute PPP Spot Exchange Rate • Assuming a Big Mac hamburger cost $2.00 in the U.S. and 300 yen in Japan. • According to the Absolute PPP formula (Absolute PPP Spot Rate = P¥ /P$), the Absolute PPP spot rate is equal to ¥300/$2 = 150 (USD/JPY) • The USD/JPY exchange rate of 150 is the equilibrium exchange rate that would produce “similar prices” for Big Macs (a similar product) in both the United States and Japan. • At the exchange rate of 150, the U.S. dollar equivalent price of the Big Mac in Japan is $2.00.
Absolute PPP Spot Exchange Rate: European Terms and American Terms • Given that the absolute PPP spot rate is simply the ratio of the two prices of similar goods (or a basket of goods) in two local currencies, we can solve for this equilibrium exchange rate for either a European terms or an American terms quoted currency as follow: • For European terms (ET): • Absolute PPPET = Foreign price/U.S. price • For American terms (AT): • Absolute PPPAT = U.S. price/Foreign price. • We then compare the calculated Absolute PPP equilibrium spot rate to the actual spot rate to determine if the currency is overvalued or undervalued.
European Terms Example • Big Mac: United States : $3.71 (excluding taxes) • Big Mac: Japan: ¥330 (excluding taxes) • Calculate Absolute PPP European Terms as follows: • Absolute PPP Spot Exchange Rate = Yen Price/Dollar Price • Absolute PPP Spot Exchange Rate = ¥330/$3.71= ¥88.95 • The Absolute PPP Spot rate is then compared to the actual rate, to determine if the current spot rate is overvalued or undervalued. • Rate on October 13, 2010: 81.85 • Question: What is this model telling us about the yen’s current spot rate (i.e., is it overvalued or undervalued?) • ANSWER: • Overvalued, by about 9% • (88.95 – 81.85)/88.95 = 0.087%
American Terms Example • Big Mac: United States: $3.71 (excluding taxes) • Big Mac: United Kingdom: £2.30 (excluding taxes) • Calculate Absolute PPP American Terms as follows: • Absolute PPP Spot Exchange Rate = Dollar Price/Pound Price • Absolute PPP Spot Exchange Rate = $3.71 / £2.30 = $1.6130 • Compare this Absolute PPP Spot rate to the actual rate: • Rate on October 13, 2010: 1.5856 • Question: What is this model telling us about the pound’s spot rate (i.e., is it overvalued or undervalued?) • ANSWER: • Undervalued (by about 2%) • (1.5856 – 1.6130) /1.5856 = 0.017%
Rules for the Absolute PPP • The Absolute PPP can be used to “estimate” whether a foreign currency’s spot rate is overvalued or undervalued and by how much using the following: • Absolute PPP European Terms: • If PPP Spot < Current Spot, then the currency is undervalued. • E.g.: PPP = 100; Current Spot = 110 • If PPP Spot > Current Spot, then the currency is overvalued. • E.g.: PPP = 100; Current Spot = 90 • Absolute PPP American Terms: • If PPP Spot > Current Spot, then the currency is undervalued. • E.g.: PPP = $1.20; Current Spot = $1.00 • If PPP Spot < Current Spot, then the currency is overvalued. • E.g.: PPP = $1.20 Current Spot = $1.40
Using the Absolute PPP • In theory, the “absolute” PPP Spot exchange rate can be used to assess the “correctness” of a current spot rate on the basis of similar goods in different countries. • It suggests the possibility that a currency is overvalued or undervalued, and by how much? • Where can we get data for the Absolute PPP model? • The "Big Mac” index. • http://www.economist.com/markets/Bigmac/Index.cfm
Big Mac Index October 14, 2010 Interpreting the Data In the United States, a Big Mac costs $3.71. In China, a Big Mac costs 14.5 yuan. Given the current exchange rate (USD/CNY) of 6.6514 a Big Mac in China works out to $2.18 (14.5/6.6514). Note this is the Big Mac price on the chart. The Absolute PPP for the yuan is the ratio of the yuan cost to the dollar cost, or: 14.5/3.71 = 3.9084. Comparing spot (6.6514) to PPP (3.9084) reveals that the yuan is undervalued by 41% (6.6514-3.9084/6.6514 = .41%)
One Test of the Big-Mac: The Introduction of the Euro • The Euro was introduced on January 1, 1999. The first day trading price was $1.1874. • According to the Big-Mac data, at the time of the euro’s introduction the Absolute PPP Spot rate could be calculated as follows: • Average price of a Big-Mac in the euro zone = €2.53 • Average price of a Big-Mac in the U.S. = $2.63 • Absolute PPP Spot rate = $2.63/€2.53 = $1.04 • Comparing the actual spot ($1.1874) to the Absolute PPP Spot ($1.04) suggested the euro was overvalued by about 12.5% at the time it began trading. • This would suggest the currency should have weakened in the period ahead.
What Happened to the Euro? The Euro: January 1, 1999 – December 31, 1999
Absolute PPP in Practice • In practice, use of the absolute PPP to test the “correctness” of a spot exchange rate depends on a number of factors: • Goods that are tradable; necessary for the assumption of competitive markets. • Goods that are comparable. Are the goods really similar in quality and quantity? • A rigorous test would involve a market basket of goods, not just one. • Market basket PPP exchange rates are published by the OECD and the World Bank. • http://stats.oecd.org/Index.aspx?datasetcode=SNA_TABLE4 • See next slide • Are there government policies (tariffs and quotas) or cultural differences which render such goods not useful for absolute PPP calculations?
Cultural Differences and Government Policy Impacts on Absolute PPP Cultural Differences Tariffs and Quotas
Testing your Understanding of the Absolute PPP Model • Given: • Czech Republic Price of a Starbuck’s Venti Latte: 105 CZK (crown) • U.S. Price of a Starbuck’s Venti Latte: $3.45 • Absolute PPP = 105/3.45 = 30.4 (USD/CZK) • Current spot rate = 17.5 (USD/CZK) • Estimate the correctness of the current spot rate for the CZK. Is it overvalued or undervalued? What trading strategy might you consider in light of your findings?
Examining Discrepancies from Absolute PPP • When a discrepancy from Absolute PPP is identified, it is probably useful to examine reasons for the discrepancy to determine if the spot rate will, or will not, move towards the Absolute PPP. • Issues to consider: • Examine the exchange rate regime and the commitment of the government for that exchange rate regime. • Does this account for the discrepancy between the Absolute PPP and the spot rate? • Chinese yuan is undervalued by 41% (Big Mac) • Are there economic or financial conditions which could account for the observed discrepancy and how long might they dominate the spot rate? • Relative economic performance, interest rates, trade balances, capital flows, etc. • Brazilian real is overvalued by 40% (Big Mac)
Relative Purchasing Power Parity • The second PPP model, the relative Purchasing Power Parity model is concerned with the “rate of change” in the exchange rate. • It is not assessing the “correctness” of the current spot rate. • The relative PPP model suggests that spot exchange rates move in a manner opposite to the inflation differential between the two countries. • Specifically, the Relative PPP model suggests that the percent change in a spot exchange rate should be equal to, but opposite in direction to, the difference in the rates of inflation between countries.
Relative PPP Example • Assume the following: • Annual rate of inflation in U.S. = 2.0% • Annual rate of inflation in U.K. = 3.0% • According to the Relative PPP, the British pound should depreciate 1% per year against the U.S. dollar. • Thus, if the current spot rate is $1.80, then • 1 year from now the spot rate should be: $1.7820 • $1.80 – (1.80 x. 01) = $1.7820 • Note: This represents a depreciation of 1% over the current spot rate. • An amount which is equal to the inflation differential. • Note: See Appendix 1 for specific Relative PPP formulas.
The Relative PPP in Practice • While historical data tends to validate the relative PPP (see last slide), the practical issue for users is estimating future rates of inflatio. • How can we do this? • Use recent historical data to estimate the future, or for a benchmark starting point. • Combine historical data with likely outcomes which might affect inflation (e.g., government deficits, economic growth, monetary policy) • Use independent forecasts of inflation date
Historical Inflation Data • Historical and Current Data: • Visit Central Bank Web sites at: • http://www.bis.org/cbanks.htm • Or visit the Economist • http://www.economist.com/index.html • Link to Economic and Financial Indicators (go to output, prices and jobs data). • See next slide
Where can we get Inflation Forecasts? • For Forecasts of Inflation: • Visit: The Economist Magazine (once a month, they publish forecasts for inflation). • See Next Slide
The Economist: Monthly Forecasts for Inflation (October 9th)
Does the Relative PPP Hold for Short Time Periods • While many studies have validated the reliability of the relative PPP model for “explaining” the long term relationship between inflation and exchange rate, studies which have examined the short term relationship have proved much less reliable. • See slides which follow. • This is generally explained on the basis of short term potential factors which can move the exchange rate away from PPP. • Safe haven effects, government intervention, carry trade transactions, dirty floats, etc.
Tests of the PPP over the Short Run The Euro The Canadian Dollar
Tests of the PPP over the Short Run The Mexican Peso Conclusions In the short-run, relative PPP will often miss the spot rate. However, in the long-run, it appears that relative PPP can at least get the trend right.
International Fisher Effect • The second major foreign exchange parity model is the International Fisher Effect (IFE). • This model uses interest rates rather than inflation rates to explain why exchange rates change over time. • The model consists of two parts: • (1) Fisher Effect which is an explanation of the market interest rate, and • (2) The International Fisher Effect which is an explanation of the relationship of market interest rates to exchange rate changes. • The model is attributed to the American economist, Irving Fisher (1895 - 1935).
Part 1: The Fisher Effect • The IFE model begins with the Fisher interest rate model: • Irving Fisher’s explanation of the market interest rate was as follows: • Market interest rate is made up of two components: • Real rate requirement; which relates to the real growth rate in the economy. • Inflationary expectations premium; which related to the markets’ expectations regarding future rates of inflation. • Or, simply put: • Market rate of interest = real rate + expected inflation • Real rate requirement is assumed to be relatively stable. • Changes only occur slowly in response to technology changes, population growth, population skills, etc. • Inflationary expectations, however, are subject to potentially wide variations over short periods of time.
Fisher Effect: International Assumptions • On an international level, the Fisher Model assumes that the real rate requirement is similar across major industrial countries. • How realistic is this assumption (see next slide)? • Thus any observed market interest rate differences between counties is accounted for on the basis of differences in inflation expectations. • Example: • If the United States 1 year market interest rate is 5% and the United Kingdom 1 year market interest rate is 7%, then: • The expected rate of inflation over the next 12 months must be 2% higher in the U.K. compared to the U.S.
Part 2: International Fisher Effect • The second part of the Fisher model, the International Fisher (IFE) effect assumes that: • Changes in spot exchange rates are related to differences in market interest rates between countries. • Why this assumption? • Because differences in interest rates capture differences in expected inflation. • IFE relationship to Exchange Rates • Currencies of high interest rate countries will weaken. • Why: These countries have high inflationary expectations • Currencies of low interest rate countries will strengthen. • Why: These countries have low inflationary expectations. • Note that the IFE is a longer term model and its conclusions differ from the short term asset choice model.
IFE Example • Assume the following: • I year Government bond rate in U.S. = 5.00% • 1 year Government bond rate Japan = 2.00% • According to the IFE, the yen should appreciate 3.0% per year against the U.S. dollar. • Thus, if the current spot rate is 120, then • 1 year from now the spot rate should be, • 120 - (120 x .03) = 116.40 • Note: This represents a appreciation of 3% over the current spot rate. • An amount which is equal to the interest rate differential. • Note: See Appendix 2 for specific IFE formulas.
Testing the IFE Model • Empirical tests of the IFE model have produced similar results as the tests of the Relative PPP. • Over the long run, the results support an IFE effect, however, over the short run, the model explains little of the future spot rate. • 1993 – 2000 data correlating quarterly interest rate differentials to quarterly exchange rate changes (An Empirical Investigation of the IFE, by Emil Sundqvist, 2002) found the following R-squares: • Swedish krona: 11.5% • Japanese yen: 8.9% • British pound: 3.6% • Canadian dollar: 1.4% • German mark: 1.4% • Conclusion: Little of the short run variation in exchange rates is explained by interest rate differential
IFE and the Short Term • Why does the IFE explain little variation in short run moves in spot exchange rates? • As with the Relative PPP, short term factors can move the spot rate away from the exchange rate predicted by the IFE. • Interest rate asset choice might dominate in short run. • Higher interest rates are expected to produce an appreciating currency. • Central banks certainly operate under this assumption.
Problematic Issues Regarding the PPP and IFE • PPP model issues: • User needs to “forecast” the future rates of inflation. • How does one do this for very long periods of time? • Perhaps it is easier for shorter time periods (e.g., 1 year). • IFE model issues: • User relies on market interest rate data to “proxy” for future inflation. • However, are real rates similar across countries? • Do real rates change over time? • Inflationary expectations during the forecasted horizon are subject to change.
Practical Use of PPP and IFE • Neither model appears appropriate for short term forecasting. • Both models work better for the long term and in this regard appear to be good indicators of the long term trend in the exchange rate: • Relatively high inflation currencies will exhibit long term depreciation. • Relatively high interest rate currencies will exhibit long term depreciation.
Appendix 1: Formulas for the Relative PPP The following slides cover the specific formulas to be used in calculated the Relative PPP spot rate for some future date. Note the formula for an American Terms quoted currency and for an European Terms quoted currency.
Relative PPP Formula: American Terms • For an American Term quoted currency: • PPP Spot Rate = Current Spot Rate x (1 + infUS)n/(1 + infF)n) • Where: • PPP Spot Rate is the expected spot rate sometime in the future. • Current spot rate is expressed in American terms. • InfUS is the expected annual rate of inflation in the United States. • InfF is the expected annual rate of inflation in the foreign country. • N is the number of years in the future.
Relative PPP Formula: American Terms • Example: • Current spot rate for British pounds = $1.80 • Expected annual rate of inflation in the U.S. = 2.0% • Expected annual rate of inflation in the U.K. = 3.0% • Then, the spot pound 2 years from now is equal to: • PPP Spot Rate = Current Spot Rate x (1 + infUS)n/(1 + infF)n) • Spot rate in 2 years = 1.80 (1+.02)2/(1+.03)2 • Spot rate in 2 years = 1.80 (1.0404/1.0609) • Spot rate in 2 years = 1.80 (.9807) • Spot rate in 2 years = $1.7653