Download
1 / 21
210 likes | 338 Vues
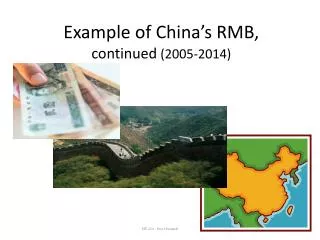
E xample of China’s RMB, continued (2005-2014). China has mostly taken the BoP surplus as fx reserves. But it also allowed RMB appreciation (2005-08 & 2011-12). Appendix: Five reasons China warranted a more flexible exchange rate regime, in its own interest.

E N D
Example of China’s RMB, continued (2005-2014) ITF-220 - Prof.J.Frankell
China has mostly taken the BoP surplus as fx reserves. But it also allowed RMB appreciation (2005-08 & 2011-12). ITF220 - Professor J.Frankel
Appendix: Five reasons China warranted a more flexible exchange rate regime, in its own interest • Overheating of economy in 2007-08 & 2010-12: => real appreciation. • Excessive reserves ($3.7 trillion as of 2014) • Harder to sterilize the inflow over time. • Attaining internal and external balance. • To attain both, need 2 policy instruments. • In a large country like China, the expenditure-switching policyshould be the exchange rate. • Along with expenditure-increasing policies (2009). • Avoiding crash: • Experience suggests it is better to exit from a peg in good times, when the BoP is strong, than to wait until the currency is under attack. • RMB undervalued, judged by Balassa-Samuelsonrelationship. ITF-220 - Prof.J.Frankell
Longer-run perspective:Balassa-Samuelson relationship • Prices of goods & services in China are low • not just low judged by Absolute PPP (.23 relative to the US), • but also low by standards of Balassa-Samuelson relationship estimated across countries (which predicts .36). • The RMB is undervalued in this specific sense. • 2000 estimate was 35% • before 2007 statistical revisions by IPC project. • Now undervaluation estimate more like 15%. ITF-220 - Prof.J.Frankell
Estimation of B-S relationship for 2000 • For every 1% increase in real income/capita (relative to US), prices increase .4% (relative). • China’s estimated residual is .15 • Using revised ICP stats. • Subramanian (2008). Frankel (2006) 118 countries, PWT ITF-220 - Prof.J.Frankell
Real appreciation • The RMB’s real appreciation against the $from 2009 to 2012 amounted to 12%, • reducing the degree of undervaluation by roughly half, • depending on whether one measures it against the $ or against all currencies. • More is expected, as China’s relative wages continue to rise. • In any case, China’s real exchange rate is already closer to this measure of equilibrium than are most countries’ exchange rates (Cheung, Chinn & Fuji, 2010).
China Adjusts, 2009-12 • Various measures suggest that China has achieved a major share of the needed trade adjustment since 2009: • Its trade surplus peaked at $300 billion in 2008, and declined thereafter. • Substantial real appreciation of the RMB has brought it closer to equilibrium. • Some nominal appreciation + • Some priceinflation and, especially, wage increases.
Adjustment of relative prices • The famous “China price”: • Ever since China rejoined the world economy 3 decades ago, its trading partners have been snapping up exports of manufacturing goods, • because low Chinese wages made them super-competitive on world markets. • But in recent years, relative prices have adjusted • following the laws of market economics.
Adjustment of relative prices, continued • The change in relative prices is reflected as real exchange rate appreciation. • This comprises, in part, nominal appreciation • and, in part, Chinese inflation. • Government officials would have been better advised to let more of the real appreciation take the form of nominal appreciation ($ per RMB). • But since they didn’t, it showed up as inflation instead. • See charts below: • appreciation,against the $ and other currencies.
Appreciation versus the US $, 2005-12 The RMB rose against the $ during 2006-08, but temporarily returned to peg in mid-2008.
China’s trade balance The surplus peaked in 2007, and then fell. Source: Reserve Bank of Australia (June 2013) China runs a deficit in primary products, offset by a surplus in manufactures.
China’s trade balance The bilateral surplus with the United Statesis as big as ever – which has no economic importance, but is politically sensitive.
The natural adjustment process was delayed. • 1st, because the authorities intervened to keep the exchange virtually fixed against the dollar, in the years 1995-2005 and 2008-2010. • 2nd, workers in China’s increasingly productive coastal factories were not paid their full value. • The economy has not completed its transition from Mao to market, after all. • As a result of these two delaying mechanisms, Chinese continued to undersell the world.
But then two things happened. • 1st, the yuan was finally allowed to appreciate against the $ during 2005-08 & 2010-11, by 25% cumulatively • =17% + 8%. • Though less against other currencies. • 2nd, labor shortages began to appear => China’s workers at last won rapid wage hikes. • Major cities raised their minimum wages sharply over each of the last 3 years: • 22% on average in 2010 & 2011; • Meanwhile another cost of business, land prices, have risen even more rapidly.
Chinese wages have been rising Source: “China’s wage inflation,” Aug. 28, 2013
Real appreciation • The RMB’s real appreciation against the $from 2009 to 2012 amounted to 12%, • reducing the degree of undervaluation by roughly half, • depending on whether one measures it against the $ or against all currencies. • More is expected, as China’s relative wages continue to rise. • In any case, China’s real exchange rate is already closer to this measure of equilibrium than are most countries’ exchange rates (Cheung, Chinn & Fuji, 2010).
5 types of adjustment are gradually taking place in response to the new high level of costs in the factories of China’s coastal provinces: • 1st, some manufacturing is migrating inland, • where wages & land prices are still relatively low. • 2nd, export operations are shifting to Vietnam or Bangla Desh • where wages are lower still. • 3rd, Chinese companies are beginning to automate, • substituting capital for labor. • 4th, they are moving into more sophisticated products, • following the path blazed earlier by Japan, Korea, & other Asian tigers • in the “flying geese” formation. • 5th, multinational companies that had in the past moved some stages of their production process to China, out of the US or out of other high-wage countries, arenow moving back.
All five of these ways of reallocating resources represent the economic process operating as it should. • None of this comes as news to most observers of China.
Many Western politicians are unable to let go of the syllogism that seemed so unassailable just a decade ago: • (1) The Chinese have joined the world economy; • (2) their wages are $0.50 an hour; • (3) there are a billion of them, and so • (4) their exports will rise without limit: “Chinese wages will never be bid up in line with the usual textbook laws of economics because the supply labor is infinitely elastic.” • But it turns out that the laws of economics do eventually apply after all -- even in China.
Expansion of the services sector.This 6th dimension of adjustment still lags behind, • despite the consensus in favor of it. • China has had great success in manufacturing • especially via exports. • Now it needs to help the other side of the economy catch up: services, via domestic demand • Retail, education, environmental quality, • health care, pensions, social safety net. • Some of this could be done via government spending • especially with the economy in slowdown in 2014, • as China did in 2009; but that was mostly heavy investment.